Preface
I wrote the first edition of this book while disabled from a car accident after which I developed chronic pain and lost partial use of my hands. Unable to chop vegetables, I wrote it from bed and the couch on an iPad to get over a failed project that haunted me called Career Explorer. Having been injured weeks before the ship date, getting the product over the line, staying up for days and doing whatever it took, became a traumatic experience. During the project, we made many mistakes I knew not to make, and I was continuously frustrated. The product bombed. A sense of failure routinely bugged me while I was stuck, horizontal on my back most of the time with intractable chronic pain. Also suffering from a heart condition, missing a third of my heartbeats, I developed dementia. My mind sank to a dark place. I could not easily find a way out. I had to find a way to fix things, to grapple with failure. Strange to say that to fix myself, I wrote a book. I needed to write directions I could give to teammates to make my next project a success. I needed to get this story out of me. More than that, I thought I could bring meaning back to my life, most of which had been shed by disability, by helping others. By doing something for the greater good. I wanted to ensure that others did not repeat my mistakes. I thought that was worth doing. There was a problem this project illustrated that was bigger than me. Most research sits on a shelf and never gets into the hands of people it can benefit. This book is a prescription and methodology for doing applied research that makes it into the world in the form of a product.
This may sound quite dramatic, but I wanted to put the first edition in personal context before introducing the second. Although it was important to me, of course, the first edition of this book was only a small contribution to the emerging field of data science. But I’m proud of it. I found salvation in its pages, it made me feel right again, and in time I recovered from illness and found a sense of accomplishment that replaced the sting of failure. So that’s the first edition.
In this second edition, I hope to do more. Put simply, I want to take a budding data scientist and accelerate her into an analytics application developer. In doing so, I draw from and reflect upon my experience building analytics applications at three Hadoop shops and one Spark shop. I hope this new edition will become the go-to guide for readers to rapidly learn how to build analytics applications on data of any size, using the lingua franca of data science, Python, and the platform of choice, Spark.
Spark has replaced Hadoop/MapReduce as the default way to process data at scale, so we adopt Spark for this new edition. In addition, the theory and process of the Agile Data Science methodology have been updated to reflect an increased understanding of working in teams. It is hoped that readers of the first edition will become readers of the second. It is also hoped that this book will serve Spark users better than the original served Hadoop users.
Agile Data Science has two goals: to provide a how-to guide for building analytics applications with data of any size using Python and Spark, and to help product teams collaborate on building analytics applications in an agile manner that will ensure success.
Agile Data Science Mailing List
You can learn the latest on Agile Data Science on the mailing list or on the web.
I maintain a web page for this book that contains the latest updates and related material for readers of the book.
Data Syndrome, Product Analytics Consultancy
I have founded a consultancy called Data Syndrome (Figure P-1) to advance the adoption of the methodology and technology stack outlined in this book. If you need help implementing Agile Data Science within your company, if you need hands-on help building data products, or if you need “big data” training, you can contact me at rjurney@datasyndrome.com or via the website.
Data Syndrome offers a video course, Realtime Predictive Analytics with Kafka, PySpark, Spark MLlib and Spark Streaming, that builds on the material from Chapters 7 and 8 to teach students how to build entire realtime predictive systems with Kafka and Spark Streaming and a web application frontend (see Figure P-2). For more information, visit http://datasyndrome.com/video or contact rjurney@datasyndrome.com.

Figure P-1. Data Syndrome
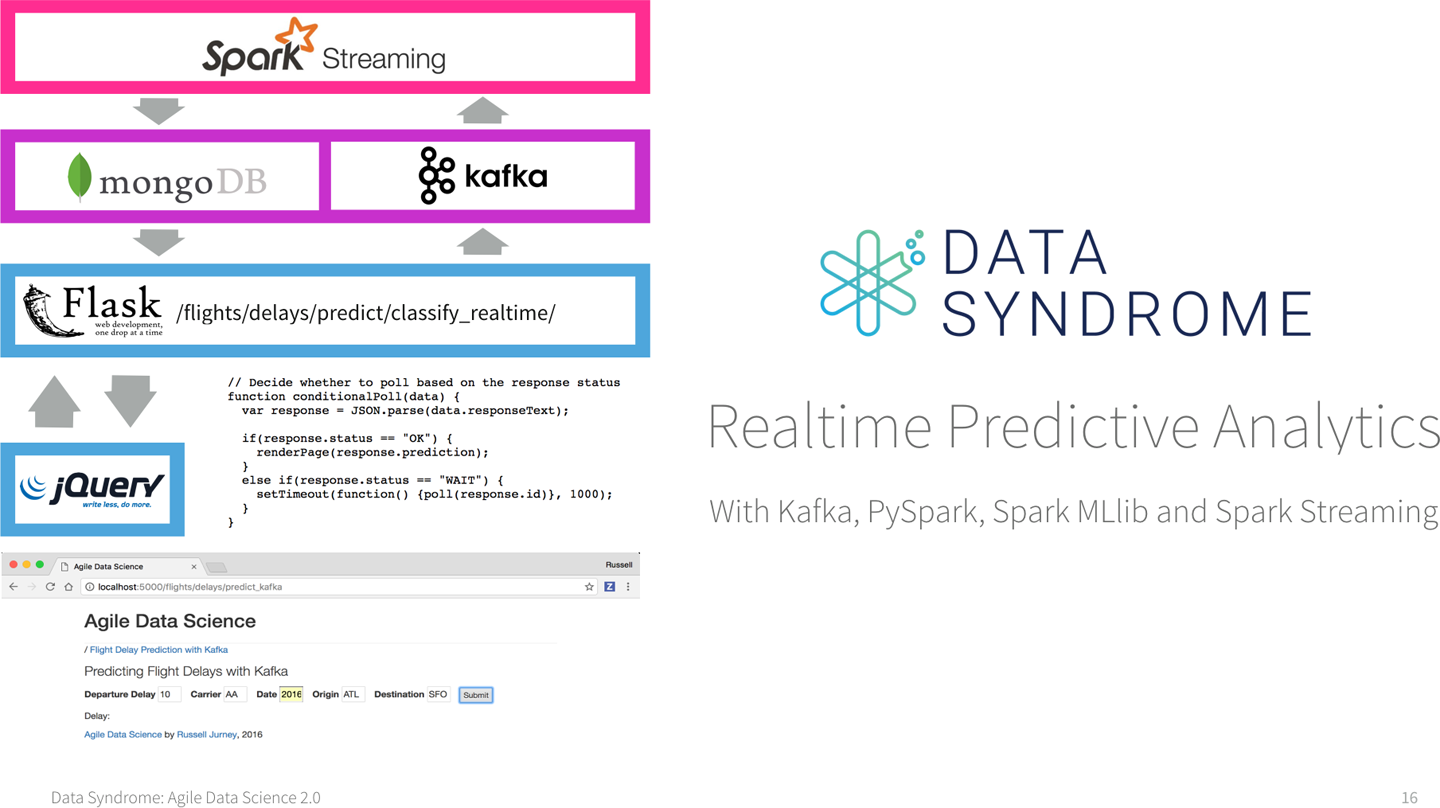
Figure P-2. Realtime Predictive Analytics video course
Live Training
Data Syndrome is developing a complete curriculum for live “big data” training for data science and data engineering teams. Current course offerings are customizable for your needs and include:
- Agile Data Science
A three-day course covering the construction of full-stack analytics applications. Similar in content to this book, this course trains data scientists to be full-stack application developers.
- Realtime Predictive Analytics
A one-day, six-hour course covering the construction of entire realtime predictive systems using Kafka and Spark Streaming with a web application frontend.
- Introduction to PySpark
A one-day, three-hour course introducing students to basic data processing with Spark through the Python interface, PySpark. Culminates in the construction of a classifier model to predict flight delays using Spark MLlib.
For more information, visit http://datasyndrome.com/training or contact rjurney@datasyndrome.com.
Who This Book Is For
Agile Data Science is intended to help beginners and budding data scientists to become productive members of data science and analytics teams. It aims to help engineers, analysts, and data scientists work with big data in an agile way using Hadoop. It introduces an agile methodology well suited for big data.
This book is targeted at programmers with some exposure to developing software and working with data. Designers and product managers might particularly enjoy Chapters 1, 2, and 5, which will serve as an introduction to the agile process without focusing on running code.
Agile Data Science assumes you are working in a *nix environment. Examples for Windows users aren’t available, but are possible via Cygwin.
How This Book Is Organized
This book is organized into two sections. Part I introduces the dataset and toolset we will use in the tutorial in Part II. Part I is intentionally brief, taking only enough time to introduce the tools. We go into their use in more depth in Part II, so don’t worry if you’re a little overwhelmed in Part I. The chapters that compose Part I are as follows:
- Chapter 1, Theory
Introduces the Agile Data Science methodology.
- Chapter 2, Agile Tools
Introduces our toolset, and helps you get it up and running on your own machine.
- Chapter 3, Data
Describes the dataset used in this book.
Part II is a tutorial in which we build an analytics application using Agile Data Science. It is a notebook-style guide to building an analytics application. We climb the data-value pyramid one level at a time, applying agile principles as we go. This part of the book demonstrates a way of building value step by step in small, agile iterations. Part II comprises the following chapters:
- Chapter 4, Collecting and Displaying Records
Helps you download flight data and then connect or “plumb” flight records through to a web application.
- Chapter 5, Visualizing Data with Charts and Tables
Steps you through how to navigate your data by preparing simple charts in a web application.
- Chapter 6, Exploring Data with Reports
Teaches you how to extract entities from your data and parameterize and link between them to create interactive reports.
- Chapter 7, Making Predictions
Takes what you’ve done so far and predicts whether your flight will be on time or late.
- Chapter 8, Deploying Predictive Systems
Shows how to deploy predictions to ensure they impact real people and systems.
- Chapter 9, Improving Predictions
Iteratively improves on the performance of our on-time flight prediction.
- Appendix A, Manual Installation
Shows how to manually install our tools.
Conventions Used in This Book
The following typographical conventions are used in this book:
- Italic
Indicates new terms, URLs, email addresses, filenames, and file extensions.
Constant widthUsed for program listings, as well as within paragraphs to refer to program elements such as variable or function names, databases, data types, environment variables, statements, and keywords.
Constant width boldShows commands or other text that should be typed literally by the user.
Constant width italicShows text that should be replaced with user-supplied values or by values determined by context.
Tip
This icon signifies a tip, suggestion, or general note.
Caution
This icon indicates a warning or caution.
Using Code Examples
Supplemental material (code examples, exercises, etc.) is available for download at https://github.com/rjurney/Agile_Data_Code_2.
This book is here to help you get your job done. In general, if example code is offered with this book, you may use it in your programs and documentation. You do not need to contact us for permission unless you’re reproducing a significant portion of the code. For example, writing a program that uses several chunks of code from this book does not require permission. Selling or distributing a CD-ROM of examples from O’Reilly books does require permission. Answering a question by citing this book and quoting example code does not require permission. Incorporating a significant amount of example code from this book into your product’s documentation does require permission.
We appreciate, but do not require, attribution. An attribution usually includes the title, author, publisher, and ISBN. For example: “Agile Data Science 2.0 by Russell Jurney (O’Reilly). Copyright 2017 Data Syndrome LLC, 978-1-491-96011-0.”
If you feel your use of code examples falls outside fair use or the permission given above, feel free to contact us at permissions@oreilly.com.
O’Reilly Safari
Note
Safari (formerly Safari Books Online) is a membership-based training and reference platform for enterprise, government, educators, and individuals.
Members have access to thousands of books, training videos, Learning Paths, interactive tutorials, and curated playlists from over 250 publishers, including O’Reilly Media, Harvard Business Review, Prentice Hall Professional, Addison-Wesley Professional, Microsoft Press, Sams, Que, Peachpit Press, Adobe, Focal Press, Cisco Press, John Wiley & Sons, Syngress, Morgan Kaufmann, IBM Redbooks, Packt, Adobe Press, FT Press, Apress, Manning, New Riders, McGraw-Hill, Jones & Bartlett, and Course Technology, among others.
For more information, please visit http://oreilly.com/safari.
How to Contact Us
Please address comments and questions concerning this book to the publisher:
- O’Reilly Media, Inc.
- 1005 Gravenstein Highway North
- Sebastopol, CA 95472
- 800-998-9938 (in the United States or Canada)
- 707-829-0515 (international or local)
- 707-829-0104 (fax)
To comment or ask technical questions about this book, send email to bookquestions@oreilly.com.
For more information about our books, courses, conferences, and news, see our website at http://www.oreilly.com.
Find us on Facebook: http://facebook.com/oreilly.
Follow us on Twitter: http://twitter.com/oreillymedia.
Watch us on YouTube: http://www.youtube.com/oreillymedia.
Get Agile Data Science 2.0 now with the O’Reilly learning platform.
O’Reilly members experience books, live events, courses curated by job role, and more from O’Reilly and nearly 200 top publishers.

