Chapter 1. Theory
We are uncovering better ways of developing software by doing it and helping others do it. Through this work we have come to value:
- Individuals and interactions over processes and tools
- Working software over comprehensive documentation
- Customer collaboration over contract negotiation
- Responding to change over following a plan
That is, while there is value in the items on the right, we value the items on the left more.
Introduction
Agile Data Science is an approach to data science centered around web application development. It asserts that the most effective output of the data science process suitable for effecting change in an organization is the web application. It asserts that application development is a fundamental skill of a data scientist. Therefore, doing data science becomes about building applications that describe the applied research process: rapid prototyping, exploratory data analysis, interactive visualization, and applied machine learning.
Agile software methods have become the de facto way software is delivered today. There are a range of fully developed methodologies, such as Scrum, that give a framework within which good software can be built in small increments. There have been some attempts to apply agile software methods to data science, but these have had unsatisfactory results. There is a fundamental difference between delivering production software and actionable insights as artifacts of an agile process. The need for insights to be actionable creates an element of uncertainty around the artifacts of data science—they might be “complete” in a software sense, and yet lack any value because they don’t yield real, actionable insights. As data scientist Daniel Tunkelang says, “The world of actionable insights is necessarily looser than the world of software engineering.” Scrum and other agile software methodologies don’t handle this uncertainty well. Simply put: agile software doesn’t make Agile Data Science. This created the motivation for this book: to provide a new methodology suited to the uncertainty of data science along with a guide on how to apply it that would demonstrate the principles in real software.
The Agile Data Science “manifesto” is my attempt to create a rigorous method to apply agility to the practice of data science. These principles apply beyond data scientists building data products in production. The web application is the best format to share actionable insights both within and outside an organization.
Agile Data Science is not just about how to ship working software, but how to better align data science with the rest of the organization. There is a chronic misalignment between data science and engineering, where the engineering team often wonder what the data science team are doing as they perform exploratory data analysis and applied research. The engineering team are often uncertain what to do in the meanwhile, creating the “pull of the waterfall,” where supposedly agile projects take on characteristics of the waterfall. Agile Data Science bridges this gap between the two teams, creating a more powerful alignment of their efforts.
This book is also about “big data.” Agile Data Science is a development methodology that copes with the unpredictable realities of creating analytics applications from data at scale. It is a theoretical and technical guide for operating a Spark data refinery to harness the power of the “big data” in your organization. Warehouse-scale computing has given us enormous storage and compute resources to solve new kinds of problems involving storing and processing unprecedented amounts of data. There is great interest in bringing new tools to bear on formerly intractable problems, enabling us to derive entirely new products from raw data, to refine raw data into profitable insights, and to productize and productionize insights in new kinds of analytics applications. These tools are processor cores and disk spindles, paired with visualization, statistics, and machine learning. This is data science.
At the same time, during the last 20 years, the World Wide Web has emerged as the dominant medium for information exchange. During this time, software engineering has been transformed by the “agile” revolution in how applications are conceived, built, and maintained. These new processes bring in more projects and products on time and under budget, and enable small teams or single actors to develop entire applications spanning broad domains. This is agile software development.
But there’s a problem. Working with real data in the wild, doing data science, and performing serious research takes time—longer than an agile cycle (on the order of months). It takes more time than is available in many organizations for a project sprint, meaning today’s applied researcher is more than pressed for time. Data science is stuck in the old-school software schedule known as the waterfall method.
Our problem and our opportunity come at the intersection of these two trends: how can we incorporate data science, which is applied research and requires exhaustive effort on an unpredictable timeline, into the agile application? How can analytics applications do better than the waterfall method that we’ve long since left behind? How can we craft applications for unknown, evolving data models? How can we develop new agile methods to fit the data science process to create great products?
This book attempts to synthesize two fields, agile development and data science on large datasets; to meld research and engineering into a productive relationship. To achieve this, it presents a new agile methodology and examples of building products with a suitable software stack. The methodology is designed to maximize the creation of software features based on the most penetrating insights. The software stack is a lightweight toolset that can cope with the uncertain, shifting sea of raw data and delivers enough productivity to enable the agile process to succeed. The book goes on to show you how to iteratively build value using this stack, to get back to agility and mine data to turn it into dollars.
Agile Data Science aims to put you back in the driver’s seat, ensuring that your applied research produces useful products that meet the needs of real users.
Definition
What is Agile Data Science (ADS)? In this chapter I outline a new methodology for analytics product development, something I hinted at in the first edition but did not express in detail. To begin, what is the goal of the ADS process?
Methodology as Tweet
The goal of the Agile Data Science process is to document, facilitate, and guide exploratory data analysis to discover and follow the critical path to a compelling analytics product (Figure 1-1. Agile Data Science “goes meta” and puts the lens on the exploratory data analysis process, to document insight as it occurs. This becomes the primary activity of product development. By “going meta,” we make the process focus on something that is predictable, that can be managed, rather than the product output itself, which cannot.
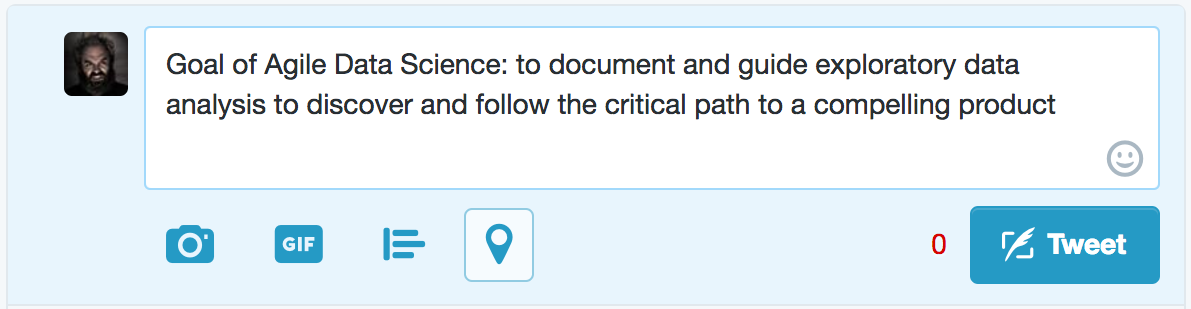
Figure 1-1. Methodology as tweet
A new agile manifesto for data science is needed.
Agile Data Science Manifesto
Agile Data Science is organized around the following principles:
Iterate, iterate, iterate: tables, charts, reports, predictions.
Ship intermediate output. Even failed experiments have output.
Prototype experiments over implementing tasks.
Integrate the tyrannical opinion of data in product management.
Climb up and down the data-value pyramid as we work.
Discover and pursue the critical path to a killer product.
Get meta. Describe the process, not just the end state.
Let’s explore each principle in detail.
Iterate, iterate, iterate
Insight comes from the twenty-fifth query in a chain of queries, not the first one. Data tables have to be parsed, formatted, sorted, aggregated, and summarized before they can be understood. Insightful charts typically come from the third or fourth attempt, not the first. Building accurate predictive models can take many iterations of feature engineering and hyperparameter tuning. In data science, iteration is the essential element to the extraction, visualization, and productization of insight. When we build, we iterate.
Ship intermediate output
Iteration is the essential act in crafting analytics applications, which means we’re often left at the end of a sprint with things that aren’t complete. If we didn’t ship incomplete or intermediate output by the end of a sprint, we would often end up shipping nothing at all. And that isn’t agile; I call it the “death loop,” where endless time can be wasted perfecting things nobody wants.
Good systems are self-documenting, and in Agile Data Science we document and share the incomplete assets we create as we work. We commit all work to source control. We share this work with teammates and, as soon as possible, with end users. This principle isn’t obvious to everyone. Many data scientists come from academic backgrounds, where years of intense research effort went into a single large paper called a thesis that resulted in an advanced degree.
Prototype experiments over implementing tasks
In software engineering, a product manager assigns a chart to a
developer to implement during a sprint. The developer translates the
assignment into a SQL GROUP BY and
creates a web page for it. Mission accomplished? Wrong. Charts that
are specified this way are unlikely to have value. Data science
differs from software engineering in that it is part science, part
engineering.
In any given task, we must iterate to achieve insight, and these iterations can best be summarized as experiments. Managing a data science team means overseeing multiple concurrent experiments more than it means handing out tasks. Good assets (tables, charts, reports, predictions) emerge as artifacts of exploratory data analysis, so we must think more in terms of experiments than tasks.
Integrate the tyrannical opinion of data
What is possible is as important as what is intended. What is easy and what is hard are as important things to know as what is desired. In software application development there are three perspectives to consider: those of the customers, the developers, and the business. In analytics application development there is another perspective: that of the data. Without understanding what the data “has to say” about any feature, the product owner can’t do a good job. The data’s opinion must always be included in product discussions, which means that they must be grounded in visualization through exploratory data analysis in the internal application that becomes the focus of our efforts.
Climb up and down the data-value pyramid
The data-value pyramid (Figure 1-2) is a five-level pyramid modeled after Maslow’s hierarchy of needs. It expresses the increasing amount of value created when refining raw data into tables and charts, followed by reports, then predictions, all of which is intended to enable new actions or improve existing ones:
The first level of the data-value pyramid (records) is about plumbing; making a dataset flow from where it is gathered to where it appears in an application.
The charts and tables layer is the level where refinement and analysis begins.
The reports layer enables immersive exploration of data, where we can really reason about it and get to know it.
The predictions layer is where more value is created, but creating good predictions means feature engineering, which the lower levels encompass and facilitate.
The final level, actions, is where the AI (artificial intelligence) craze is taking place. If your insight doesn’t enable a new action or improve an existing one, it isn’t very valuable.
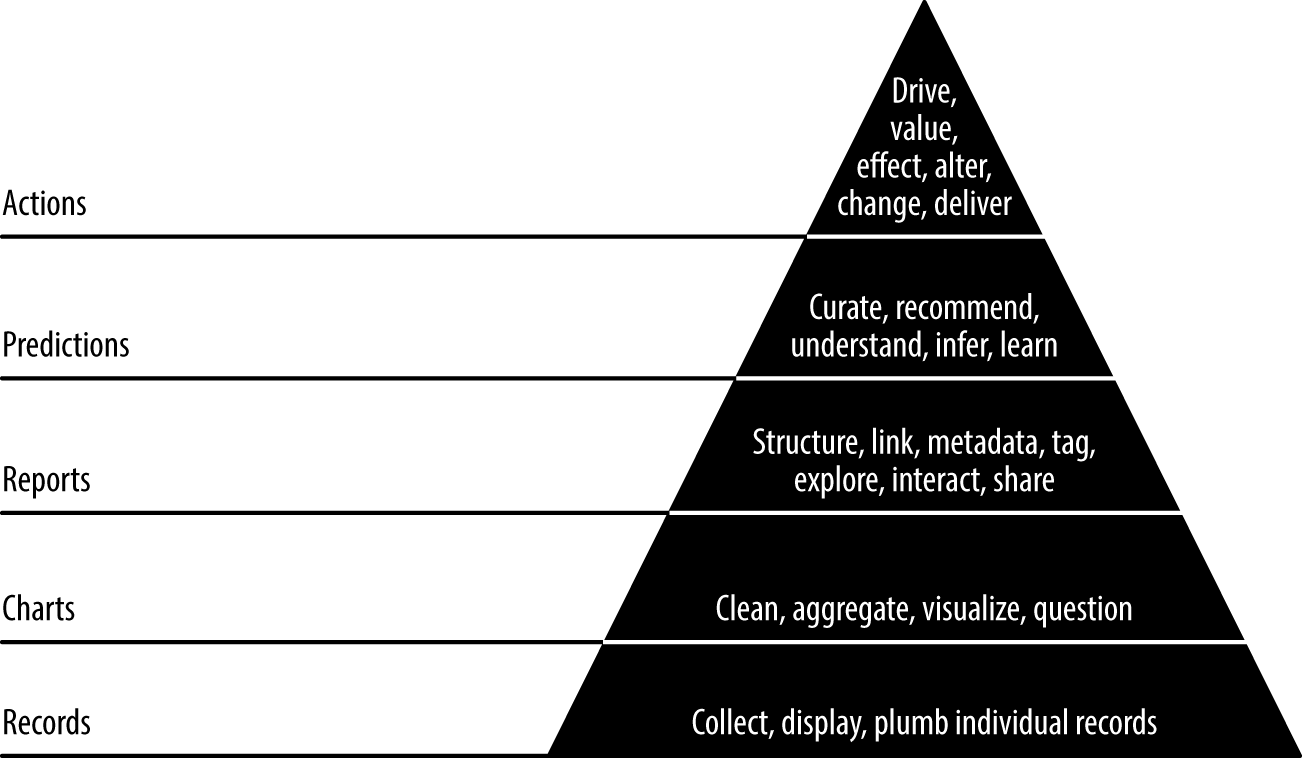
Figure 1-2. The data-value pyramid
The data-value pyramid gives structure to our work. The pyramid is something to keep in mind, not a rule to be followed. Sometimes you skip steps, sometimes you work backward. If you pull a new dataset directly into a predictive model as a feature, you incur technical debt if you don’t make this dataset transparent and accessible by adding it to your application data model in the lower levels. You should keep this in mind, and pay off the debt as you are able.
Discover and pursue the critical path to a killer product
To maximize our odds of success, we should focus most of our time on that aspect of our application that is most essential to its success. But which aspect is that? This must be discovered through experimentation. Analytics product development is the search for and pursuit of a moving goal.
Once a goal is determined, for instance a prediction to be made, then we must find the critical path to its implementation and, if it proves valuable, to its improvement. Data is refined step by step as it flows from task to task. Analytics products often require multiple stages of refinement, the employment of extensive ETL (extract, transform, load) processes, techniques from statistics, information access, machine learning, artificial intelligence, and graph analytics.
The interaction of these stages can form complex webs of dependencies. The team leader holds this web in his head. It is his job to ensure that the team discovers the critical path and then to organize the team around completing it. A product manager cannot manage this process from the top down; rather, a product scientist must discover it from the bottom up.
Get meta
If we can’t easily ship good product assets on a schedule comparable to developing a normal application, what will we ship? If we don’t ship, we aren’t agile. To solve this problem, in Agile Data Science, we “get meta.” The focus is on documenting the analytics process as opposed to the end state or product we are seeking. This lets us be agile and ship intermediate content as we iteratively climb the data-value pyramid to pursue the critical path to a killer product. So where does the product come from? From the palette we create by documenting our exploratory data analysis.
Synthesis
These seven principles work together to drive the Agile Data Science methodology. They serve to structure and document the process of exploratory data analysis and transform it into analytics applications. So that is the core of the method. But why? How did we get here? Let’s take a look at a waterfall project to understand the problems these types of projects create.
Tip
LinkedIn Career Explorer was an analytics application developed at LinkedIn in 2010 using the waterfall methodology, and its ultimate failure motivated the creation of this book. I was a newly hired Senior Data Scientist for Career Explorer. In this second edition, I use Career Explorer as a case study to briefly explore the problems discovered with the waterfall method during its eight-month development.
The Problem with the Waterfall
I should explain and get out of the way the fact that Career Explorer was the first recommender system or indeed predictive model that I had ever built. Much of its failure was due to my inexperience. My experience was in iterative and agile interactive visualization, which seemed a good fit for the goals of the project, but actually the recommendation task was more difficult than had been anticipated in the prototype—as it turned out, much more work was needed on the entity resolution of job titles than was foreseen.
At the same time, issues with the methodology employed on the product hid the actual state of the product from management, who were quite pleased with static mock-ups only days before launch. Last-minute integration revealed bugs in the interfaces between components that were exposed to the customer. A hard deadline created a crisis when the product proved unshippable with only days to go. In the end, I stayed up for the better part of a week resubmitting Hadoop jobs every five minutes to debug last-minute fixes and changes, and the product was just barely good enough to go out. This turned out not to matter much, as users weren’t actually interested in the product concept. In the end, a lot of work was thrown away only months after launch.
The key issues with the project were to do with the waterfall methodology employed:
The application concept was only tested in user focus groups and managerial reviews, and it failed to actually engage user interest.
The prediction presentation was designed up front, with the actual model and its behavior being an afterthought. Things went something like this:
“We made a great design! Your job is to predict the future for it.”
“What is taking so long to reliably predict the future?”
“The users don’t understand what 86% true means.”
Plane → Mountain.
Charts were specified by product/design and failed to achieve real insights.
A hard deadline was specified in a contract with a customer.
Integration testing occurred at the end of development, which precipitated a deadline crisis.
Mock-ups without real data were used throughout the project to present the application to focus groups and to management.
This is all fairly standard for a waterfall project. The result was that management thought the product was on track with only two weeks to go when integration finally revealed problems. Note that Scrum was used throughout the project, but the end product was never able to be tested with end users, thus negating the entire point of the agile methodology employed. To sum it up, the plane hit the mountain.
By contrast, there was another project at LinkedIn called InMaps that I led development on and product managed. It proceeded much more smoothly because we iteratively published the application using real data, exposing the “broken” state of the application to internal users and getting feedback across many release cycles. It was the contrast between these two projects that helped formalize Agile Data Science in my mind.
But if the methodology employed on Career Explorer was actually Scrum, why was it a waterfall project? It turns out that analytics products built by data science teams have a tendency to “pull” toward the waterfall. I would later discover the reason for this tendency.
Research Versus Application Development
It turns out that there is a basic conflict in shipping analytics products, and that is the conflict between the research and the application development timeline. This conflict tends to make every analytics product a waterfall project, even those that set out to use a software engineering methodology like Scrum.
Research, even applied research, is science. It involves iterative experiments, in which the learning from one experiment informs the next experiment. Science excels at discovery, but it differs from engineering in that there is no specified endpoint (see Figure 1-3).
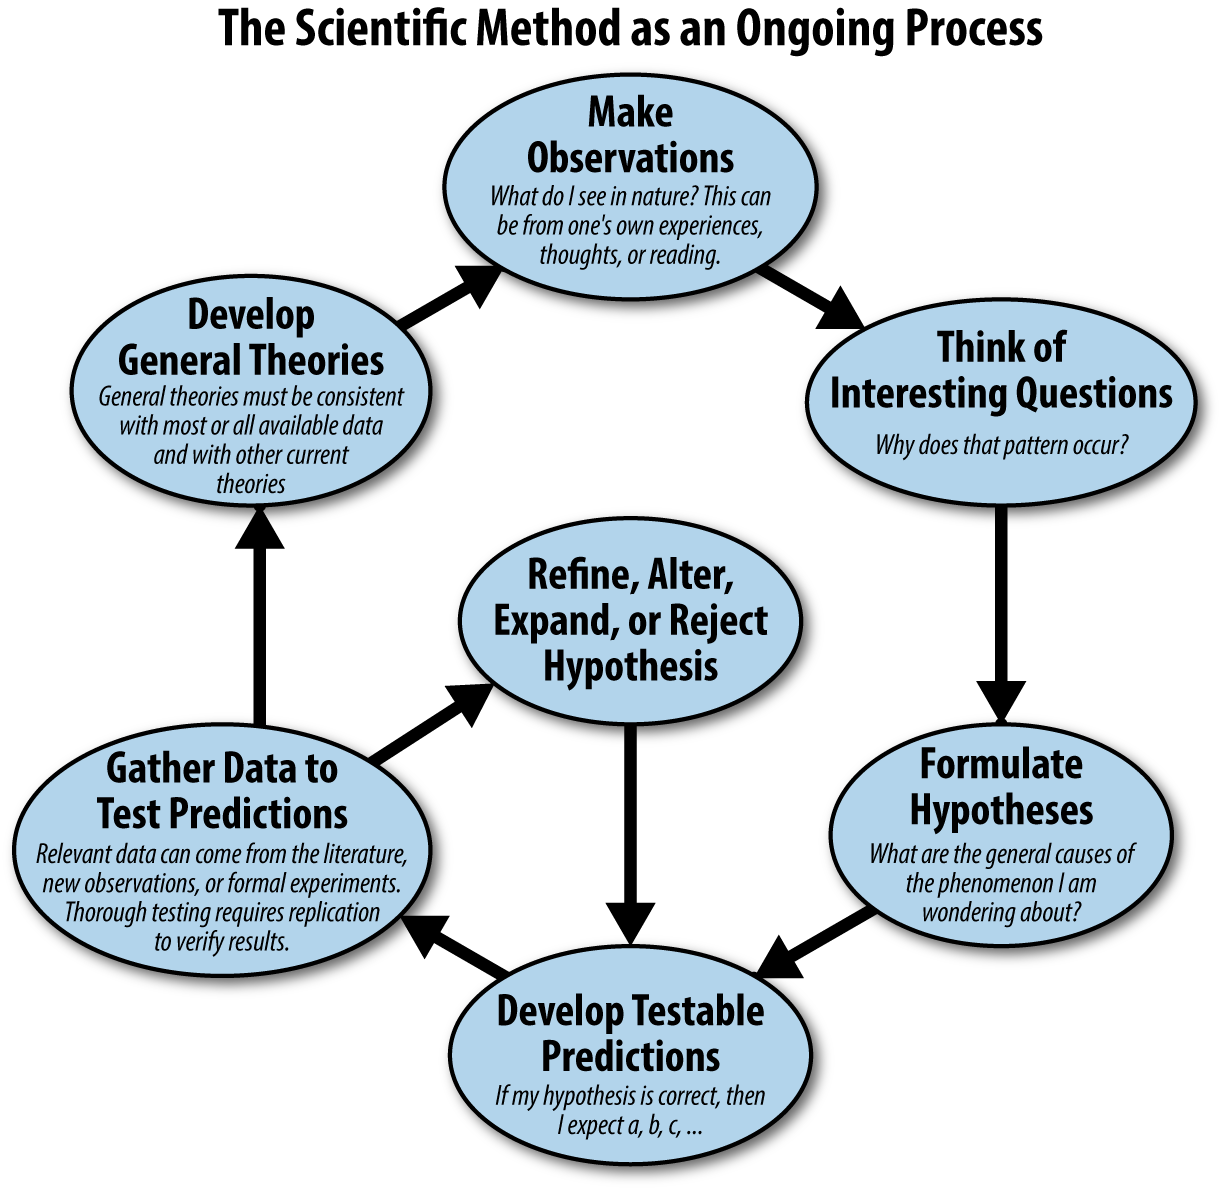
Figure 1-3. The scientific method, from Wikipedia
Engineering employs known science and engineering techniques to build things on a linear schedule. Engineering looks like the Gantt chart in Figure 1-4. Tasks can be specified, monitored, and completed.
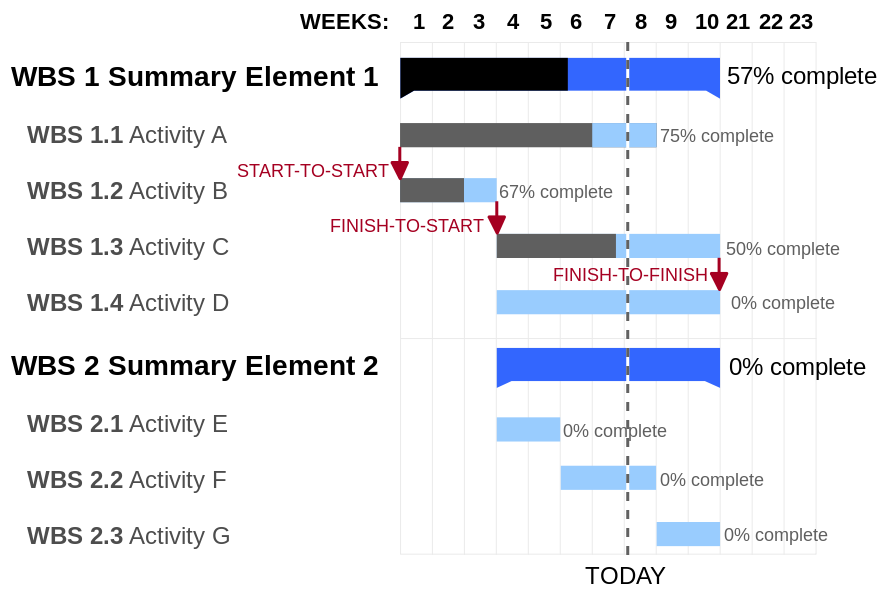
Figure 1-4. Gantt chart, from Wikipedia
A better model of an engineering project looks like the PERT chart in Figure 1-5, which can model complex dependencies with nonlinear relationships. Note that even in this more advanced model, the points are known. The work is done during the lines.
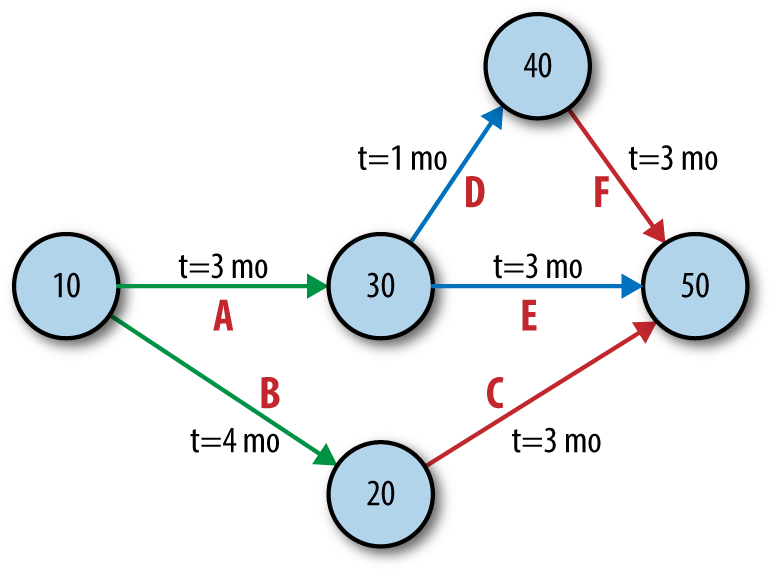
Figure 1-5. PERT chart, from Wikipedia
In other words: engineering is precise, and science is uncertain. Even relatively new fields such as software engineering, where estimates are often off by 100% or more, are more certain than the scientific process. This is the impedance mismatch that creates the problem.
In data science, the science portion usually takes much longer than the engineering portion, and to make things worse, the amount of time a given experiment will take is uncertain. Uncertainty in length of time to make working analytics assets—tables, charts, and predictions—tends to cause stand-ins to be used in place of the real thing. This results in feedback on a mock-up driving the development process, which aborts agility. This is a project killer.
The solution is to get agile... but how? How do agile software methodologies map to data science, and where do they fall short?
The Problem with Agile Software
Agile Software isn’t Agile Data Science. In this section we’ll look at the problems with mapping something like Scrum directly into the data science process.
Eventual Quality: Financing Technical Debt
Technical debt is defined by Techopedia as “a concept in programming that reflects the extra development work that arises when code that is easy to implement in the short run is used instead of applying the best overall solution.” Understanding technical debt is essential when it comes to managing software application development, because deadline pressure can result in the creation of large amounts of technical debt. This technical debt can cripple the team’s ability to hit future deadlines.
Technical debt is different in data science than in software engineering. In software engineering you retain all code, so quality is paramount. In data science you tend to discard most code, so this is less the case. In data science we must check in everything to source control but must tolerate a higher degree of ugliness until something has proved useful enough to retain and reuse. Otherwise, applying software engineering standards to data science code would reduce productivity a great deal. At the same time, a great deal of quality can be imparted to code by forcing some software engineering knowledge and habits onto academics, statisticians, researchers, and data scientists.
In data science, by contrast to software engineering, code shouldn’t always be good; it should be eventually good. This means that some technical debt up front is acceptable, so long as it is not excessive. Code that becomes important should be able to be cleaned up with minimal effort. It doesn’t have to be good at any moment, but as soon as it becomes important, it must become good. Technical debt forms part of the web of dependencies in managing an Agile Data Science project. This is a highly technical task, necessitating technical skills in the team leader or a process that surfaces technical debt from other members of the team.
Prototypes are financed on technical debt, which is paid off only if a prototype proves useful. Most prototypes will be discarded or minimally used, so the technical debt is never repaid. This enables much more experimentation for fewer resources. This also occurs in the form of Jupyter and Zeppelin notebooks, which place the emphasis on direct expression rather than code reuse or production deployment.
The Pull of the Waterfall
The stack of a modern “big data” application is much more complex than that of a normal application. Also, there is a very broad skillset required to build analytics applications at scale using these systems. This wide pipeline in terms of people and technology can result in a “pull” toward the waterfall even for teams determined to be agile.
Figure 1-6 shows that if tasks are completed in sprints, the thickness of the stack and team the combine to force a return to the waterfall model. In this instance a chart is desired, so a data scientist uses Spark to calculate the data for one and puts it into the database. Next, an API developer creates an API for this data, followed by a web developer creating a web page for the chart. A visualization engineer creates the actual chart, which a designer visually improves. Finally, the product manager sees the chart and another iteration is required. It takes an extended period to make one step forward. Progress is very slow, and the team is not agile.
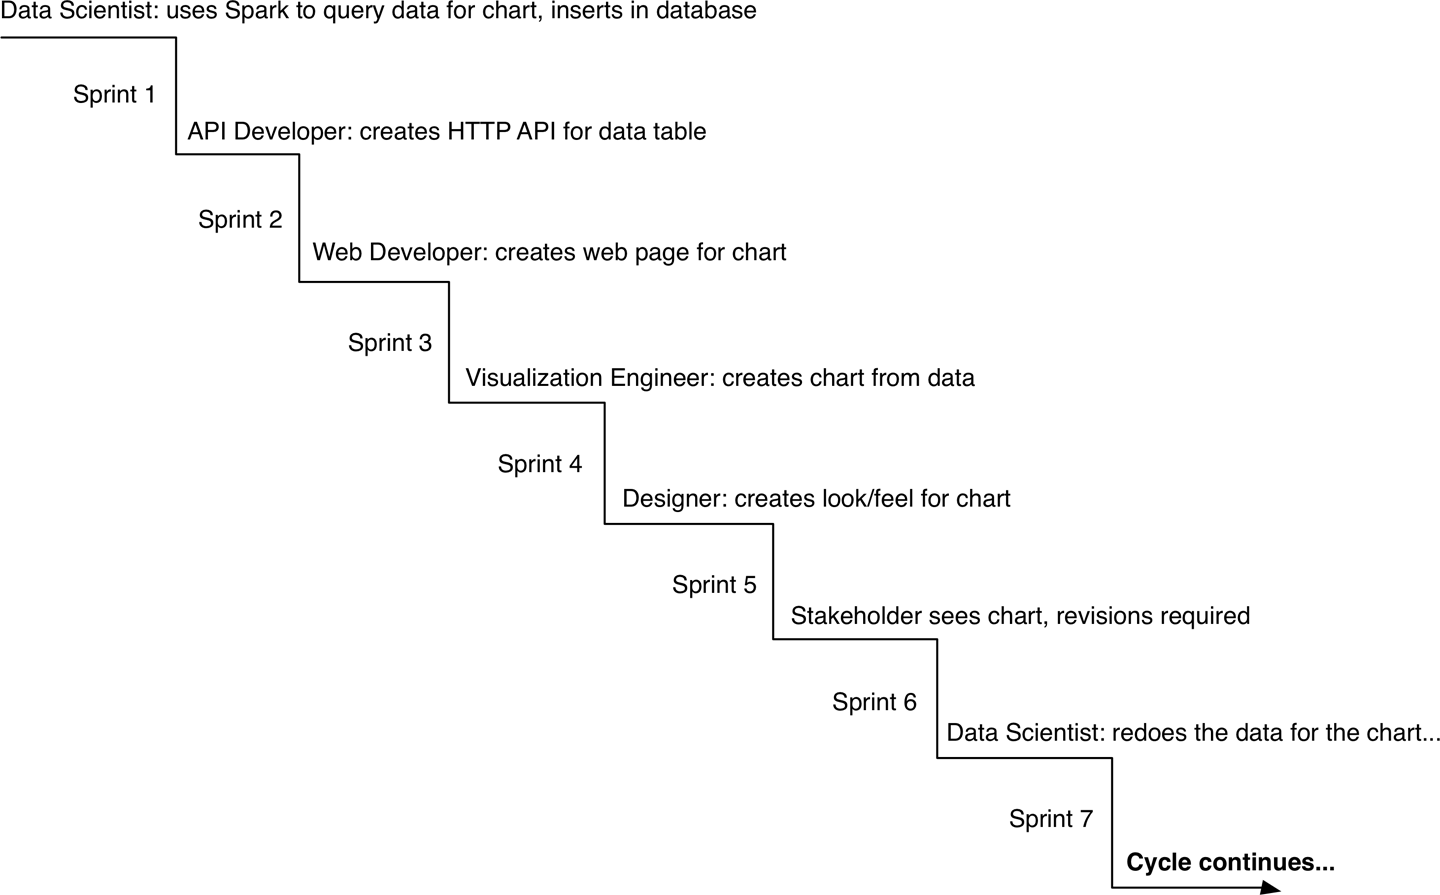
Figure 1-6. Sprint based cooperation becoming anything but agile
This illustrates a few things. The first is the need for generalists who can accomplish more than one related task. But more importantly, it shows that it is necessary to iterate within sprints as opposed to iterating in compartments between them. Otherwise, if you wait an entire sprint for one team member to implement the previous team member’s work, the process tends to become a sort of stepped pyramid/waterfall.
The Data Science Process
Having introduced the methodology and described why it is needed, now we’re going to dive into the mechanics of an Agile Data Science team. We begin with setting expectations, then look at the roles in a data science team, and finally describe how the process works in practice. While I hope this serves as an introduction for readers new to data science teams or new to Agile Data Science, this isn’t an exhaustive description of how agile processes work in general. Readers new to agile and new to data science are encouraged to consult a book on Scrum before consuming this chapter.
Now let’s talk about setting expectations of data science teams, and how they interact with the rest of the organization.
Setting Expectations
Before we look at how to compose data science teams and run them to produce actionable insights, we first need to discuss how a data science team fits into an organization. As the focus of data science shifts in Agile Data Science from a pre-determined outcome to a description of the applied research process, so must the expectations for the team change. In addition, the way data science teams relate to other teams is impacted.
“When will we ship?” is the question management wants to know the answer to in order to set expectations with the customer and coordinate sales, marketing, recruiting, and other efforts. With an Agile Data Science team, you don’t get a straight answer to that question. There is no specific date X when prediction Y will be shippable as a web product or API. That metric, the ship date of a predetermined artifact, is something you sacrifice when you adopt an Agile Data Science process. What you get in return is true visibility into the work of the team toward your business goals in the form of working software that describes in detail what the team is actually doing. With this information in hand, other business processes can be aligned with the actual reality of data science, as opposed to the fiction of a known shipping date for a predetermined artifact.
With a variable goal, another question becomes just as important: “What will we ship?” or, more likely, “What will we ship, when?” To answer these questions, any stakeholder can take a look at the application as it exists today as well as the plans for the next sprint and get a sense of where things are and where they are moving.
With these two questions addressed, the organization can work with a data science team as the artifacts of their work evolve into actionable insights. A data science team should be tasked with discovering value to address a set of business problems. The form the output of their work takes is discovered through exploratory research. The date when the “final” artifacts will be ready can be estimated by careful inspection of the current state of their work. With this information in hand, although it is more nuanced than a “ship date,” managers positioned around a data science team can sync their work and schedules with the team.
In other words, we can’t tell you exactly what we will ship, when. But in exchange for accepting this reality, you get a constant, shippable progress report, so that by participating in the reality of doing data science you can use this information to coordinate other efforts. That is the trade-off of Agile Data Science. Given that schedules with pre-specified artifacts and ship dates usually include the wrong artifacts and unrealistic dates, we feel this trade-off is a good one. In fact, it is the only one we can make if we face the reality of doing data science.
Data Science Team Roles
Products are built by teams of people, and agile methods focus on people over process. Data science is a broad discipline, spanning analysis, design, development, business, and research. The roles of Agile Data Science team members, defined in a spectrum from customer to operations, look something like Figure 1-7.

Figure 1-7. The roles in an Agile Data Science team
These roles can be defined as follows:
Customers use your product, click your buttons and links, or ignore you completely. Your job is to create value for them repeatedly. Their interest determines the success of your product.
Business Development signs early customers, either firsthand or through the creation of landing pages and promotion, and delivers traction in the market with the product.
Marketers talk to customers to determine which markets to pursue. They determine the starting perspective from which an Agile Data Science product begins.
Product managers take in the perspectives of each role, synthesizing them to build consensus about the vision and direction of the product.
User experience designers are responsible for fitting the design around the data to match the perspective of the customer. This role is critical, as the output of statistical models can be difficult to interpret by “normal” users who have no concept of the semantics of the model’s output (i.e., how can something be 75% true?).
Interaction designers design interactions around data models so users find their value.
Web developers create the web applications that deliver data to a web browser.
Engineers build the systems that deliver data to applications.
Data scientists explore and transform data in novel ways to create and publish new features and combine data from diverse sources to create new value. They make visualizations with researchers, engineers, web developers, and designers, exposing raw, intermediate, and refined data early and often.
Applied researchers solve the heavy problems that data scientists uncover and that stand in the way of delivering value. These problems take intense focus and time and require novel methods from statistics and machine learning.
Platform or data engineers solve problems in the distributed infrastructure that enable Agile Data Science at scale to proceed without undue pain. Platform engineers handle work tickets for immediate blocking bugs and implement long-term plans and projects to maintain and improve usability for researchers, data scientists, and engineers.
Quality assurance engineers automate testing of predictive systems from end to end to ensure accurate and reliable predictions are made.
Operations/DevOps engineers ensure smooth setup and operation of production data infrastructure. They automate deployment and take pages when things go wrong.
Recognizing the Opportunity and the Problem
The broad skillset needed to build data products presents both an opportunity and a problem. If these skills can be brought to bear by experts in each role working as a team on a rich dataset, problems can be decomposed into parts and directly attacked. Data science is then an efficient assembly line, as illustrated in Figure 1-8.
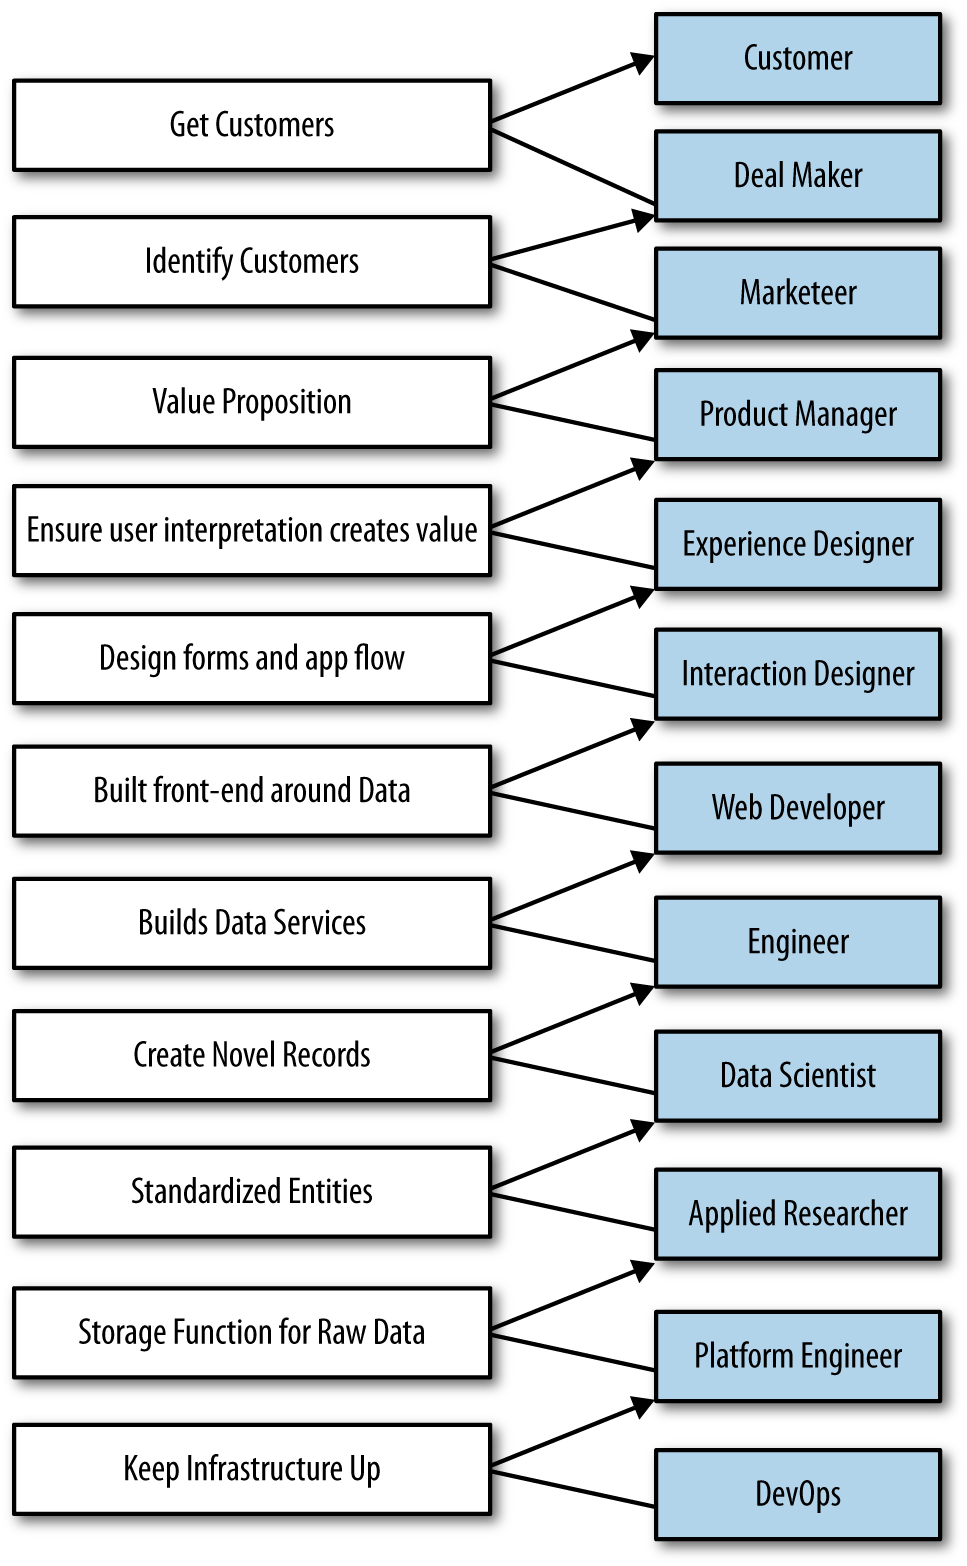
Figure 1-8. Expert contributor workflow
However, as team size increases to satisfy the need for expertise in these diverse areas, communication overhead quickly dominates. A researcher who is eight persons away from customers is unlikely to solve relevant problems and more likely to solve arcane problems. Likewise, team meetings of a dozen individuals are unlikely to be productive. We might split this team into multiple departments and establish contracts of delivery between them, but then we lose both agility and cohesion. Waiting on the output of research, we invent specifications, and soon we find ourselves back in the waterfall method.
And yet we know that agility and a cohesive vision and consensus about a product are essential to our success in building products. The worst product-development problem is one team working on more than one vision. How are we to reconcile the increased span of expertise and the disjoint timelines of applied research, data science, software development, and design?
Adapting to Change
To remain agile, we must embrace and adapt to these new conditions. We must adopt changes in line with lean methodologies to stay productive.
Several changes in particular make a return to agility possible:
Choosing generalists over specialists
Preferring small teams over large teams
Using high-level tools and platforms: cloud computing, distributed systems, and platforms as a service (PaaS)
Continuous and iterative sharing of intermediate work, even when that work may be incomplete
In Agile Data Science, a small team of generalists uses scalable, high-level tools and platforms to iteratively refine data into increasingly higher states of value. We embrace a software stack leveraging cloud computing, distributed systems, and platforms as a service. Then we use this stack to iteratively publish the intermediate results of even our most in-depth research to snowball value from simple records to predictions and actions that create value and let us capture some of it to turn data into dollars.
Let’s examine each item in detail.
Harnessing the power of generalists
In Agile Data Science, we value generalists over specialists, as shown in Figure 1-9.

Figure 1-9. Broad roles in an Agile Data Science team
In other words, we measure the breadth of teammates’ skills as much as the depth of their knowledge and their talent in any one area. Examples of good Agile Data Science team members include:
Designers who deliver working CSS
Web developers who build entire applications and understand the user interface and user experience
Data scientists capable of both research and building web services and applications
Researchers who check in working source code, explain results, and share intermediate data
Product managers able to understand the nuances in all areas
Design in particular is a critical role in the Agile Data Science team. Design does not end with appearance or experience. Design encompasses all aspects of the product, from architecture, distribution, and user experience to work environment.
Note
In the documentary The Lost Interview, Steve Jobs said this about design: “Designing a product is keeping five thousand things in your brain and fitting them all together in new and different ways to get what you want. And every day you discover something new that is a new problem or a new opportunity to fit these things together a little differently. And it’s that process that is the magic.”
Leveraging agile platforms
In Agile Data Science, we use the easiest-to-use, most approachable distributed systems, along with cloud computing and platforms as a service, to minimize infrastructure costs and maximize productivity. The simplicity of our stack helps enable a return to agility. We use this stack to compose scalable systems in as few steps as possible. This lets us move fast and consume all the available data without running into scalability problems that cause us to discard data or remake our application in-flight. That is to say, we only build it once, and it adapts.
Sharing intermediate results
Finally, to address the very real differences in timelines between researchers and data scientists and the rest of the team, we adopt a sort of data collage as our mechanism of melding these disjointed scales. In other words, we piece our app together from the abundance of views, visualizations, and properties that form the “menu” for the application.
Researchers and data scientists, who work on longer timelines than agile sprints typically allow, generate data daily—albeit not in a “publishable” state. But in Agile Data Science, there is no unpublishable state. The rest of the team must see weekly, if not daily (or more often), updates to the state of the data. This kind of engagement with researchers is essential to unifying the team and enabling product management.
That means publishing intermediate results—incomplete data, the scraps of analysis. These “clues” keep the team united, and as these results become interactive, everyone becomes informed as to the true nature of the data, the progress of the research, and how to combine the clues into features of value. Development and design must proceed from this shared reality. The audience for these continuous releases can start small and grow as they become more presentable (as shown in Figure 1-10), but customers must be included quickly.
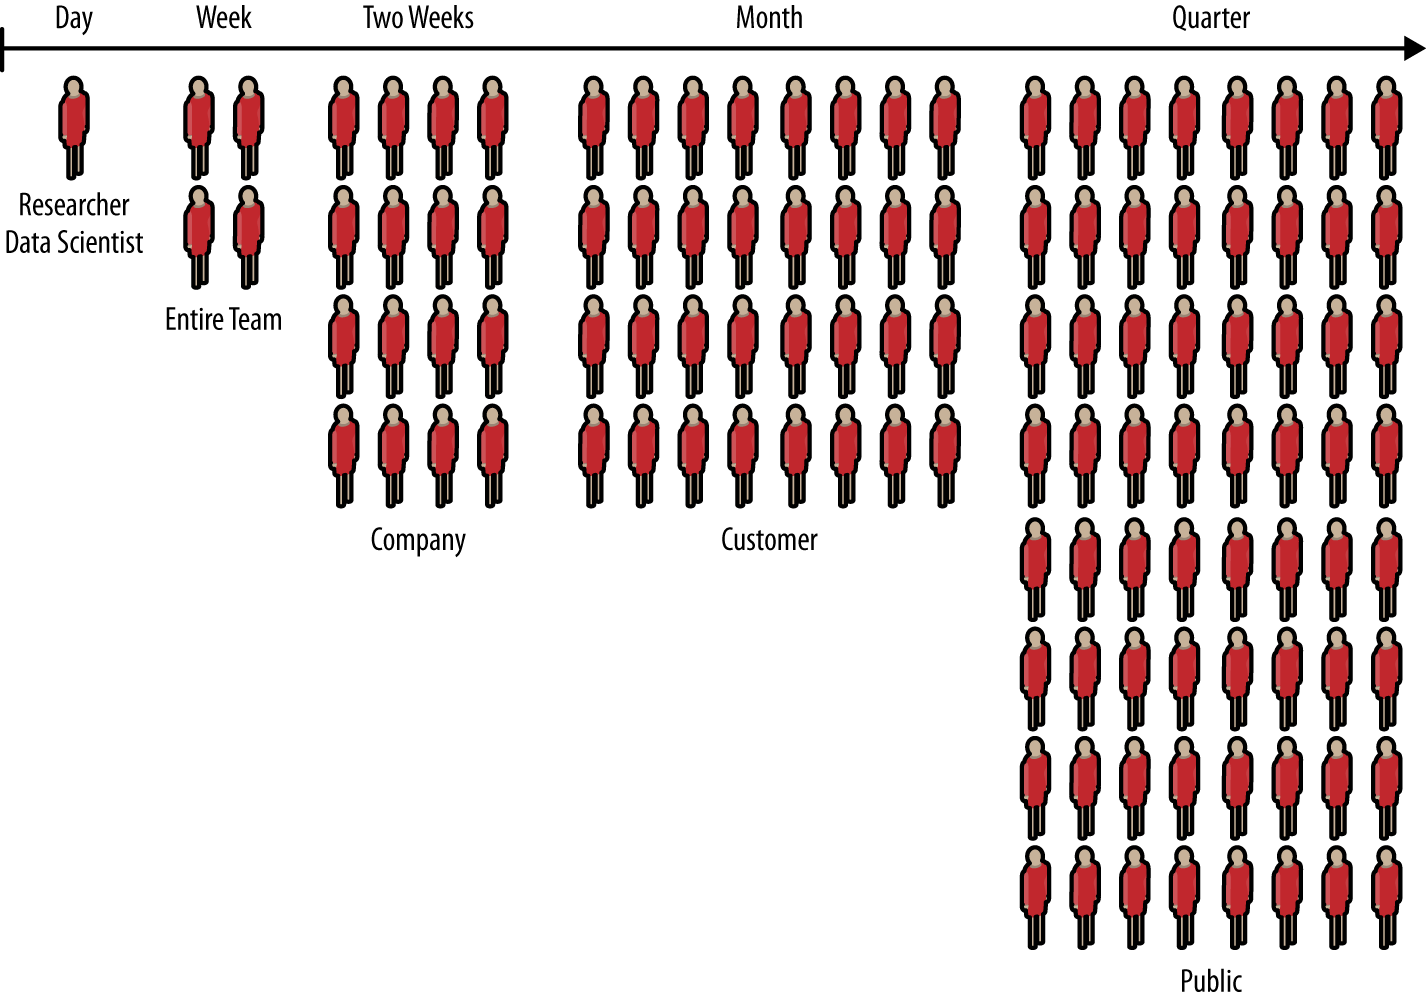
Figure 1-10. Growing audience from conception to launch
Notes on Process
The Agile Data Science process embraces the iterative nature of data science and the efficiency our tools enable to build and extract increasing levels of structure and value from our data.
Given the spectrum of skills within a data science team, the possibilities are endless. With the team spanning so many disciplines, building web products is inherently collaborative. To collaborate, teams need direction: every team member passionately and tenaciously pursuing a common goal. To get that direction, you require consensus.
Building and maintaining consensus while collaborating is the hardest part of building software. The principal risk in software product teams is building to different blueprints. Clashing visions result in incohesive holes that sink products.
Applications are sometimes mocked before they are built: product managers conduct market research, while designers iterate mocks with feedback from prospective users. These mocks serve as a common blueprint for the team.
Real-world requirements shift as we learn from our users and conditions change, even when the data is static. So our blueprints must change with time. Agile methods were created to facilitate implementation of evolving requirements, and to replace mock-ups with real working systems as soon as possible.
Typical web products—those driven by forms backed by predictable, constrained transaction data in relational databases—have fundamentally different properties than products featuring mined data. In CRUD (create, read, update, delete) applications, data is relatively consistent. The models are predictable SQL tables or documents, and changing them is a product decision. The data’s “opinion” is irrelevant, and the product team is free to impose its will on the model to match the business logic of the application.
In interactive products driven by mined data, none of that holds. Real data is dirty. Mining always involves dirt. If the data wasn’t dirty, it wouldn’t be data mining. Even carefully extracted and refined mined information can be fuzzy and unpredictable. Presenting it on the consumer internet requires long labor and great care.
In data products, the data is ruthlessly opinionated. Whatever we wish the data to say, it is unconcerned with our own opinions. It says what it says. This means the waterfall model has no application. It also means that mocks are an insufficient blueprint to establish consensus in software teams.
Mocks of a data product are a specification of the application without its essential character, the true value of the information being presented. Mocks as blueprints make assumptions about complex data models they have no reasonable basis for making. When specifying lists of recommendations, mocks often mislead. When mocks specify full-blown interactions, they do more than that: they suppress reality and promote assumption. And yet we know that good design and user experience are about minimizing assumption. What are we to do?
The goal of agile product development is to identify the essential character of an application and to build that up first before adding other features. This imparts agility to the project, making it more likely to satisfy its real, essential requirements as they evolve. In data products, that essential character will surprise you. If it doesn’t, either you are doing it wrong, or your data isn’t very interesting. Information has context, and when that context is interactive, insight is not predictable.
Code Review and Pair Programming
To avoid systemic errors, data scientists must share their code with the rest of the team on a regular basis. This makes formal code review important.
It is easy to detect and fix errors in parsing. Systemic errors in algorithms are much harder to detect without a second, third, fourth pair of eyes. And they need not all be data scientists—if a data scientist presents her code with an explanation of what is happening, any programmer can catch inconsistencies and make helpful suggestions. What is more, having a formal code review process sets the standard for writing code that is understandable and can be shared and explained.
Without code review, a data scientist could end up sinking enormous efforts into improving a predictive model that is doing the wrong thing. Systemic errors are incredibly difficult to detect in your own code, as when reading your own code, your mind reads what you intended and not what you actually wrote.
Code review in every sprint is essential to maintaining standards of quality and readability; it is essential to avoid systemic errors in algorithmic work, and it fosters a sense of inclusion and sharing on the team. This cultural impact is perhaps the most important aspect of code review, because it creates cross-training among team members who become proficient at understanding and fixing components of the system they don’t usually work on or maintain. You’ll be glad you have a code review process in place when a critical data scientist or data engineer is out sick and you need someone else to find and fix a bug in production.
Agile Environments: Engineering Productivity
Rows of cubicles like cells of a hive. Overbooked conference rooms camped and decamped. Microsoft Outlook a modern punchcard. Monolithic insanity. A sea of cubes.
Deadlines interrupted by oscillating cacophonies of rumors shouted, spread like waves uninterrupted by naked desks. Headphone budgets. Not working, close together. Decibel induced telecommuting. The open plan.
Competing monstrosities seeking productivity but not finding it.
Poem by the author
Generalists require more uninterrupted concentration and quiet than do specialists. That is because the context of their work is broader, and therefore their immersion is deeper. Their environment must suit this need.
Invest in two to three times the space of a typical cube farm, or you are wasting your people. In this setup, some people don’t need desks, which drives costs down.
We can do better. We should do better. It costs more, but it is inexpensive.
In Agile Data Science, we recognize team members as creative workers, not office workers. We therefore structure our environment more like a studio than an office. At the same time, we recognize that employing advanced mathematics on data to build products requires quiet contemplation and intense focus. So we incorporate elements of the library as well.
Many enterprises limit their productivity enhancement of employees to the acquisition of skills. However, about 86% of productivity problems reside in the work environment of organizations. The work environment has effect on the performance of employees. The type of work environment in which employees operate determines the way in which such enterprises prosper.
Akinyele Samuel Taiwo
It is much higher cost to employ people than it is to maintain and operate a building, hence spending money on improving the work environment is the most cost effective way of improving productivity because of small percentage increase in productivity of 0.1% to 2% can have dramatic effects on the profitability of the company.
Derek Clements-Croome and Li Baizhan
Creative workers need three kinds of space to collaborate and build together. From open to closed, they are: collaboration space, personal space, and private space.
Collaboration space
Collaboration space is where ideas are hatched. Situated along main thoroughfares and between departments, collaborative spaces are bright, open, comfortable, and inviting. They have no walls. They are flexible and reconfigurable. They are ever-changing, always being rearranged, and full of beanbag chairs, pillows, and comfortable chairs. Collaboration space is where you feel the energy of your company: laughter, big conversations, excited voices talking over one another. Invest in and showcase these areas. Real, not plastic, plants keep sound from carrying—and they make air!
Private space
Private space is where deadlines are met. Enclosed and soundproof, private spaces are libraries. There is no talking. Private space minimizes distractions: think dim light and white noise. There are beanbags, couches, and chairs, but ergonomics demand proper workstations too. These spaces might include separate sit/stand desks with docking stations behind (bead) curtains with 30-inch customized LCDs.
Personal space
Personal space is where people call home. In between collaboration and private space in its degree of openness, personal space should be personalized by each individual to suit his or her needs (e.g., shared office or open desks, half or whole cube). Personal space should come with a menu and a budget. Themes and plant life should be encouraged. This is where some people will spend most of their time. On the other hand, given adequate collaborative and private space, a notebook, and a mobile device, some people don’t need personal space at all.
Above all, the goal of the agile environment is to create immersion in data through the physical environment: printouts, posters, books, whiteboards, and more, as shown in Figure 1-11.

Figure 1-11. Data immersion through collage
If you offer the team the three types of space, you will have a happy, productive team that can tackle data science challenges efficiently.
Realizing Ideas with Large-Format Printing
Easy access to large-format printing is a requirement for the agile environment. Visualization in material form encourages sharing, collage, expressiveness, and creativity.
Several companies make 24-inch-wide large-format printers that cost less than $1,000. Continuous ink delivery systems are available for less than $100 that bring the operational cost of large-format printing—for instance, 24×36-inch posters—to less than $1 per poster.
At this price point, there is no excuse not to give a data team easy access to several large-format printers for both plain-paper proofs and glossy prints. It is very easy to get people excited about data across departments when they can see concrete proof of the progress of the data science team.
Get Agile Data Science 2.0 now with the O’Reilly learning platform.
O’Reilly members experience books, live events, courses curated by job role, and more from O’Reilly and nearly 200 top publishers.

