Although it’s no secret that some companies have cooked their books, you can spot signs of questionable bookkeeping before the results or subpoenas are served.
Company books are never cooked evenly—at least some of the numbers are real. It’s more like they’ve been microwaved for a few minutes on high rather than baked at 325 degrees until done to perfection. Perhaps the most egregious example of this is Enron, whose saga, along with its master chefs Lay, Skilling, and Fastow, has been beaten to death in the financial press. For all the coverage, hard analysis of the numbers has been hard to find. By putting financial statements under the microscope, you have a chance to spot suspect numbers and cash out of investments whose accounting practices are questionable. Analyzing Enron’s and WorldCom’s financial statements can help you learn what to look for—and avoid.
Earnings are the obvious number to cook, because that’s what the market pays attention to. A good place to start hunting for numbers that don’t make sense is the balance sheet: a statement of a company’s assets, liabilities, and shareholders’ equity. The tenacious financial chef can make balance sheets lie, but companies rarely fudge their balance sheets because Wall Street simply doesn’t pay that much attention to them. For that reason, you have a better chance of uncovering the truth about a company’s cash flow by comparing successive balance sheets to determine where the money came from and where it went during a particular period. The cash flow analysis offered by the Spredgar analysis application flow statement found in 10-K and 10-Q filings, but it points out problems you might not catch otherwise.
Most Wall Street firms had Enron as a strong buy up until the company filed for bankruptcy. Apparently, the analysts weren’t doing much analyzing during this period. Instead, they were mostly cheerleading—on the company’s behalf, their firm’s, and, ultimately, their own.
Tip
During the bull market, analysts seemed to be everywhere. Analysts pumping stocks brought to their brokerage firms lucrative investment banking deals, which in turn fattened the analysts’ paychecks with bonuses calculated mostly by the amount of investment banking business they generated. Now, fewer analysts than ever cover stocks, because stock analysts have recently become part of brokerage cost centers rather than profit centers.
Enron’s balance sheet smelled a bit overcooked as far back as 1997. Looking at the comparison of Enron’s EPS to the cash flow that the company generated, shown in Figure 4-36, earnings were positive 15 out of 16 quarters, but cash flow was in the black only three times during the same period. Remember from the introduction to Chapter 3 that net income from the bottom of the income statement appears at the top of the statement of cash flows. So, where did the earnings go?
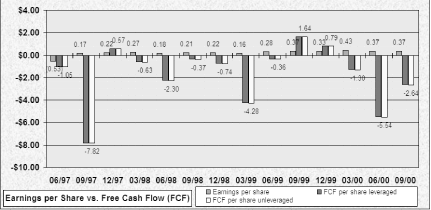
Let’s take a closer look at the September 1997 quarter, in which earnings per share were a positive 17 cents a share, whereas free cash flow was a whopping negative $7.82. The cash flow statement generated by Spredgar in Figure 4-37 shows a company that required $5.9 billion (cell L134) in net investment activity and $6.2 billion (cell N134) in net financing activity to generate only $134 million in net income (cell D133)! Its return on equity (ROE) during the period was a meager 2.7 percent—using bogus numbers!
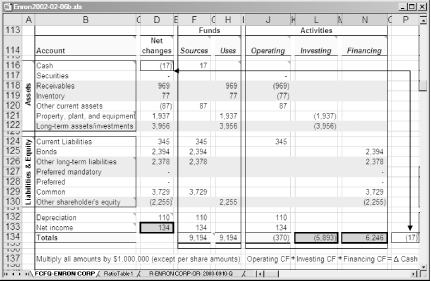
Judging from this figure, a significant amount of stock and bonds have been issued. But what are these stocks and bonds actually financing? Given the almost $6 billion flowing to investments, they are finding investments of some kind. Although the authorities are still sorting through the financial wreckage, we now know about the notorious special purpose entities (SPEs), which hid Enron’s debt. Enron would transfer an asset (often of dubious value) and its associated debt to a subsidiary. The parent company would receive a note payable in return, which would show up as an “investment” on Enron’s balance sheet. GAAP rules permitted the debt to stay off Enron’s balance sheet as long as outsiders (in this case, usually Enron top management) had at least a three percent ownership of the SPE.
We also know that Enron stock was transferred to these SPEs, which also created a note payable to the parent. It might have been possible for the SPEs to sell off some of that stock, thus generating phony income back to the parent and possibly some for the outside investors. As long as the stock price stayed up, the financial house of cards was more or less intact. When the Wall Street Journal scrutinized the SPEs in late 2001, a falling stock price hastened Enron’s demise.
WorldCom spun a similar tale to Enron in terms of fudging the financials. In WorldCom’s case, it was a ploy of capitalizing some costs instead of recording them properly as expenses, which (surprise!) resulted in higher reported earnings.
How so? It stems from how capitalization and depreciation affect a company’s earnings. When a company spends a big wad of money to purchase equipment or other things that it will use over a long period of time, the big wad of money doesn’t show up as an expense on the income statement. If it did, earnings would take a huge hit in the year of the purchase, and then would look particularly good for all the remaining years when the equipment helps the company make money with no expenses to match. Depreciation is an accounting mechanism that, in effect, spreads the cost of a capitalized purchase over the useful life of the asset. The purchase cost appears as a use of cash on the cash flow statement; the value of the asset shows up on the balance sheet; and each year of the equipment’s useful life, a depreciation expense appears on the income statement. Let’s look at a simple example. If a company has revenues of $100,000 and expenses of $50,000, its net income is $50,000. However, if the company plays games and transforms the $50,000 in expenses into capitalized expenditures, the straight-line depreciation assuming no salvage value would be one-fifth of the $50,000 for five years. This ploy increases the net income to $90,000 for the year.
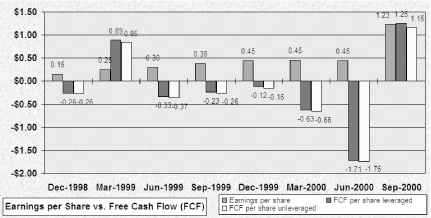
As we did with Enron, let’s compare WorldCom’s EPS to free cash flow. Figure 4-38 shows a Spredgar comparison from September 1998 through September 2000. Except for two periods, free cash flow is negative—and often dramatically less than reported positive earnings.
How is this possible? Let’s take a look at Spredgar’s net balance sheet cash flow for the quarter ending December 1998, shown in Figure 4-39. WorldCom’s expenses most likely show up in the Property, plant, and equipment (PP&E) line item (cell D93). During this period PP&E was more than five times reported net income! This number doesn’t represent long-term assets and investments, which are listed on the next line. From eight quarters starting in October 1998, PP&E ranged from 80 to 400 percent of net income. Stuffing expenses into this area enabled WorldCom to report net income as positive, while the correct categorization of expenses resulted in a loss.
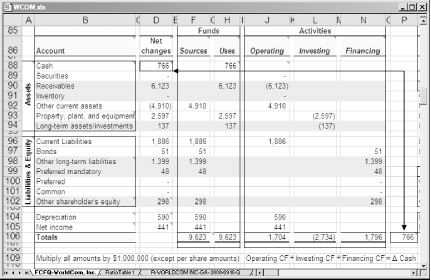
Because of WorldCom’s capitalization games, depreciation (cell D104) is higher than net income for the period. If you’re capitalizing expenses, you must depreciate and amortize them, which results in high depreciation and amortization expenses. This is not likely to happen to a legitimate business, because it implies purchases of assets that don’t produce sufficient income. However, for the next seven quarters, WorldCom’s depreciation and amortization ran between 30 and 100 percent of net income
Because these evasive tricks do appear from time to time, you can compare financial measures to industry averages [Hack #23] and [Hack #24] #34] to highlight numbers that appear out of whack. For example, WorldCom’s return on equity averaged 3.6 percent during this period compared to AT&T’s ROE of over 13 percent. Asset turnover [Hack #31] compares even worse, with WorldCom’s at .1 and AT&T’s at .7 (seven times higher).
By using tools such as Spredgar, you can scrutinize numbers to find good explanations or perhaps bad business practices. If the numbers don’t give you the answers you’re looking for, call investor relations and ask them to explain. And, if those answers aren’t much help, perhaps it’s time to find another company.
—Gordon Gerwig
Get Online Investing Hacks now with the O’Reilly learning platform.
O’Reilly members experience books, live events, courses curated by job role, and more from O’Reilly and nearly 200 top publishers.

