Use turnover ratios to see if a company’s management is using its assets effectively to generate profits.
Every company management team aims to deploy its assets to generate the most profits possible. It doesn’t do any good for a company to own assets, such as factories, inventory, or even cash, if they’re not being used to maximum advantage. There are three ratios that investors typically evaluate to measure the efficiency of company management: asset turnover ratio, inventory turnover ratio, and receivable turnover ratio.
The first ratio to consider is the asset turnover ratio, which assesses the sales that a company can generate for each dollar of assets it owns—the higher the asset turnover ratio, the better. Companies with high asset turnover ratios can thrive even with low profit margins.
The asset turnover ratio is calculated using the formula in Example 4-36.
Example 4-36. Formula for the asset turnover ratio
Asset Turnover Ratio = Total Revenue for Period / Average Assets for Period
Companies report the value of their assets on their balance sheets included in the financial statement section of their SEC 10-Q and 10-K filings. However, they report the value of those assets as they stood at the end of the year. You can calculate the average assets for the period by averaging the year-end values for total assets for the current and previous years.
Tip
You can use total assets in place of average assets, mostly for the sake of simplicity. However, average assets better represent a company’s efficiency.
The financial data spreadsheets available at EdgarScan (http://edgarscan.pwcglobal.com) provide a quick way to obtain the necessary values.
Let’s look at Home Depot’s asset turnover ratio. Table 4-4 shows pertinent Home Depot financials.
Table 4-4. Home Depot measures from EdgarScan needed for calculating the asset turnover ratio
|
Financial measure |
Value in millions |
|---|---|
|
2003 total operating revenue |
$58,247.0 |
|
2003 total assets |
$30,011.0 |
|
2002 total assets |
$26,394.0 |
Using the assets from each period, the average assets are $28,202.5 million. Plug these values into the formula to determine Home Depot’s asset turnover for the year, as shown in Example 4-37.
Example 4-37. Formula for Home Depot’s asset turnover ratio
Home Depot's Asset Turnover Ratio = 58,247.0 / 28,202.5
                                  = 2.1
You can use the AVERAGE function to calculate the
average assets, as shown in Example 4-38.
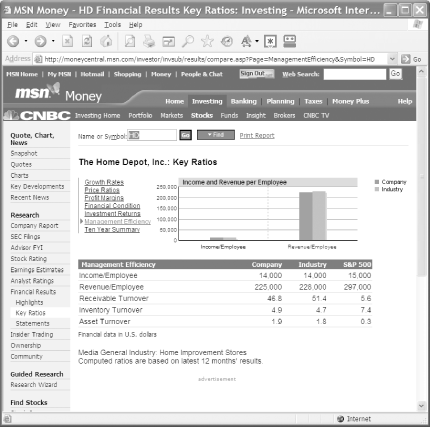
MSN Money (http://money.msn.com) provides asset turnover and other turnover ratios for companies, industry turnover averages, and average turnover values for the S&P 500 index. As you can see in Figure 4-14, Home Depot’s asset turnover ratio of 1.9 compares favorably to other companies in its industry, which has an average asset turnover ratio of 1.8.
Tip
Companies with high asset turnover ratios tend to have lower profit margins (and vice versa). That doesn’t mean that companies with higher or lower asset turnover ratios are better long-term investments. It’s just an indication of a common business strategy of selling a high volume of goods at a small increase over cost.
The inventory turnover ratio is an indicator of how quickly a company moves its inventory out of warehouses, factories, or stores, and into the hands of customers. The formula to calculate the ratio looks like Example 4-39.
Example 4-39. Formula for inventory turnover ratio
Inventory Turnover Ratio = Total Revenue / Average Inventory
Total revenue appears on the income statement and inventory appears on the balance sheet. You must calculate the average value of inventory from the most recently reported inventory value and the value from the same period a year earlier. Using a spreadsheet of extracted financial data downloaded from EdgarScan (http://edgarscan.pwcglobal.com), you can quickly calculate the inventory turnover ratio for a company.
Tip
Sometimes, the inventory turnover ratio is calculated by dividing the cost of goods sold by average inventory. Either method is acceptable—just make sure that you compute your ratios using the same method when comparing a company to its competitors or industry.
Continuing the evaluation of Home Depot’s efficiency ratios, Table 4-5 shows pertinent Home Depot financials for calculating the inventory turnover ratio.
Table 4-5. Home Depot measures from EdgarScan needed for calculating the inventory turnover ratio
|
Financial measure |
Value in millions |
|---|---|
|
2003 total operating revenue |
$58,247.0 |
|
2003 total inventories |
$8,338.0 |
|
2002 total inventories |
$5,489.0 |
Using the assets from each period, the average inventory is $6,913.5 million. Using these values, Example 4-40 shows Home Depot’s inventory turnover ratio for the year.
Example 4-40. Home Depot’s inventory turnover ratio
Home Depot's Inventory Turnover Ratio = 58,247.0 / $6,913.5
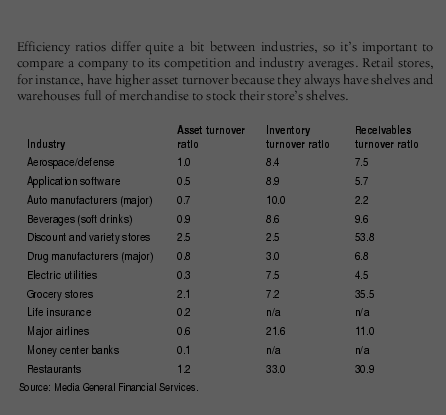
= 8.4When it comes to evaluating the inventory turnover ratio, higher is better. As is standard practice, you should compare a company’s inventory turnover to its competitors. Retail stores and grocery chains usually have higher rates of inventory turnover, because they sell a lot of low-cost products. Heavy equipment makers generally have lower turnover ratios, because bulldozers and cranes each sell for hundreds of thousands (or even millions) of dollars. You can see average inventory turnover ratios in the sidebar earlier in this hack.
Tip
Financial companies don’t have inventory like manufacturing or retail companies do, so this ratio doesn’t apply to them.
You can quickly check a company’s inventory turnover ratio at MSN Money (http://money.msn.com) and compare it to the industry average inventory turnover ratio and the average for the S&P 500 index. As shown in Figure 4-14, Home Depot’s inventory turnover ratio of 4.9 compares favorably to other companies in its industry, which average 4.7.
Product inventories are the least liquid assets that a company owns, and unsold inventory quickly becomes a money-losing proposition. Last year’s fashions become this year’s bargain basement buys, outdated technology lands in the junk pile, and spoiled food goes into the garbage. This is why it’s important for companies to manage their inventories closely. In the last decade, industries ranging from auto manufacturers to computer hardware makers have increasingly turned to methods that keep their inventory levels at a minimum, such as just in time delivery of parts and materials from suppliers, or building goods to order that are immediately shipped to customers, as Dell does with computers.
A low inventory turnover ratio is sometimes a signal that a company is out of step with customer demand for its products—its products are not succeeding in the marketplace, because of obsolescence or poor quality. However, companies sometimes stock up their warehouses to prepare for a new product rollout or for the holiday sale season, so you should dig deeper into the reasons.
The third ratio to consider is the receivables turnover ratio. Accounts receivable (also known as receivables) are a company’s uncollected income from customers, such as unpaid invoices. Higher receivables turnover ratios are preferable to lower ones, because companies run the risk of never collecting on open invoices if they delay too long. In addition, those receivables represent income, which most companies need to pay their own bills. Example 4-41 shows the formula for receivables turnover ratio.
Example 4-41. Formula for receivables turnover ratio
Receivables Turnover Ratio = Total Revenue / Average Receivables
The receivables turnover ratio reveals how many times a company has collected its receivables during a period. Unlike assets and inventories, receivables have a more immediate element of timeliness, and you use more recent values to calculate the receivables turnover ratio. Instead of averaging the receivables from the current and prior years, you calculate the average from the most recent two quarters.
Tip
Some analysts and data providers calculate average receivables by using two year-end values, whereas others use five quarters. As long as you use the same method when looking at competitors or industry averages, you can use any method to compute average receivables.
Continuing the evaluation of Home Depot’s efficiency ratios, Table 4-6 shows pertinent Home Depot financials for calculating the receivables turnover ratio.
Table 4-6. Home Depot measures from EdgarScan needed for calculating the receivables turnover ratio
|
Financial measure |
Value in millions |
|---|---|
|
2003 total operating revenue |
$58,247.0 |
|
2003 total receivables |
$1,072.0 |
|
Third quarter 2002 total receivables |
$1,379.0 |
Using these values, you can calculate Home Depot’s receivables turnover ratio for the year, as shown in Example 4-42.
Example 4-42. Home Depot’s receivables turnover ratio
Home Depot's Receivables Turnover Ratio = 58,247.0 / 1,225.5
                                        = 47.5
Is a receivables turnover ratio of 47.5 good? As with most retail stores, the bulk of Home Depot’s customers pay with cash or credit cards that the company almost immediately turns into cash at the bank, so the company’s ratio is quite good. You can see average inventory turnover ratios in the earlier sidebar “Industry Average Efficiency Turnover Ratios (2002).” As with the inventory turnover ratio, financial stocks don’t report receivables, so the receivables turnover ratio isn’t applicable for these companies.
You can also quickly compare the company to its industry at MSN Money, as shown in Figure 4-14. A low receivables turnover ratio compared to the competition is cause for concern. Home Depot doesn’t compare as favorably with this ratio as it does with other efficiency ratios. Its receivables turnover ratio of 46.8 is slightly lower than the industry average of 51.4, but it is still high enough to safeguard the company from obsolete inventory.
Tip
Very high receivables turnover ratios, such as Home Depot’s, indicate highly efficient companies that can usually delay paying their own bills while quickly collecting on money that’s owed them. By doing this, companies obtain the equivalent of an interest-free loan. Averages vary by industry, so a 30-day payment period could be common practice or completely unattainable.
In addition to MSN Money, you can also find management effectiveness ratios for companies and industries calculated at Reuters Investor (http://www.investor.reuters.com).
—Douglas Gerlach
Get Online Investing Hacks now with the O’Reilly learning platform.
O’Reilly members experience books, live events, courses curated by job role, and more from O’Reilly and nearly 200 top publishers.

