Chapter 4. Beating the Odds
Why risk more than you have to when you take risks? Casino games require you to take some chances, but this chapter of real-world stat hacks will help you keep your edge and perhaps even overcome the house’s edge.
Start with Texas Hold ‘Em poker [Hack #36]. (Maybe you’ve heard of it?) When you play poker [Hack #37], play the odds [Hack #38].
Make sure, of course, to always gamble smart [Hack #35], regardless of what you play, though when it comes to the level of risk you take, some games [Hacks #39 and #40] are better than others [Hack #41].
If you like to make friendly wagers with friends or strange wagers with strangers, you can use the power of statistics to win some surprisingly winnable bar bets with cards [Hacks #42 and #44], dice [Hack #43], or just about anything else you can think of [Hack #46], including your friends’ birthdays [Hack #45].
Speaking of weird gambling games (and I think we were), there are some odd statistical quirks [Hacks #47 and #49] you’ll need to know when you play them, even if it is just flipping a coin [Hack #48].
Gamble Smart
Whatever the game, if money and chance are involved, there are some basic gambling truths that can help the happy statistician stay happy.
Although this chapter is full of hacks aimed at particular games, many of them games of chance, there are a variety of tips and tools that are useful across the board for all gamblers. Much mystery, superstition, and mathematical confusion pervade the world of gambling, and knowing a little more about the geography of this world should help you get around. This hack shows how to gamble smarter by teaching you about the following things:
The Gambler’s Fallacy
Did you ever have so many bad blackjack hands in a row that you increased your bet, knowing that things were due to change anytime now? If so, you succumbed to the gambler’s fallacy, a belief that because there are certain probabilities expected in the long run, a short-term streak of bad luck is likely to change soon.
The gambler’s fallacy is that there is a swinging pendulum of chance and it swings in the region of bad outcomes for a while, loses momentum, and swings back into a region of good outcomes for a while. The problem with following this mindset is that luck, as it applies to games of pure chance, is a series of independent events, with each individual outcome unrelated to the outcome that came before. In other words, the location of the pendulum in a good region or bad region is unrelated to where it was a second before, and—here’s the rub—there isn’t even a pendulum. The fickle finger of fate pops randomly from possible outcome to possible outcome, and the probability of it appearing at any outcome is the probability associated with each outcome. There is no momentum. This truth is often summarized as “the dice have no memory.”
Examples of beliefs consistent with the gambler’s fallacy include:
A poker player who has had nothing but bad hands all evening will soon get a super colossal hand to even things out.
A losing baseball team that has lost the last three games is more likely to win the fourth.
Because rolling dice and getting three 7s in a row is unlikely to occur, rolling a fourth after having just rolled three straight must be basically impossible.
A roulette ball that has landed on eight red numbers in a row pretty much must hit a black number next.
Avoid fallacies like this at all costs, and gambling should cost you less.
Casinos and Money
Casinos make money. One reason they make a profit is that the games themselves pay off amounts of money that are slightly less than the amount of money that would be fair. In a game of chance, a fair payout is one that makes both participants, the casino and the player, break even in the long run.
An example of a fair payout would be for casinos to use roulette wheels with only 36 numbers on them, half red and half black. The casino would then double the money of those who bet on red after a red number hits. Half the time the casino would win, and half the time the player would win. In reality, American casinos use 38 numbers, two of them neither red nor black. This gives the house a 2/38 edge over a fair payout. Of course, it’s not unfair in the general sense for a casino to make a profit this way; it’s expected and part of the social contract that gamblers have with the casinos. The truth is, though, that if casinos made money only because of this edge, few would remain in business.
The second reason that casinos make money is that gamblers do not have infinitely deep pockets, and they do not gamble an infinite period of time. The edge that a casino has—the 5.26 percent on roulette, for example—is only the amount of money they would take if a gambler bet an infinite number of times. This infinite gambler would be up for a while, down for a while, and at any given time, on average, would be down 5.26 percent from her starting bankroll.
What happens in real life, though, is that most players stop playing sometime, usually when they are out of chips. Most players keep betting when they have money and stop betting when they don’t. Some players, of course, walk away when they are ahead. No player, though, keeps playing when they have no money (and no credit).
Imagine that Table 4-1 represents 1,000 players of any casino game. All players started with $100 and planned to spend an evening (four hours) playing the games. We’ll assume a house edge of 5.26 percent, as roulette has, though other games have higher or lower edges.
| Time spent playing | Have some money left | Mean bankroll left | Have lost all their money | Still playing |
| After an hour of play | 900 | $94.74 | 100 | 900 |
| After two hours of play | 800 | $94.74 | 200 | 800 |
| After three hours of play | 700 | $94.74 | 300 | 700 |
| After four hours of play | 600 | $94.74 | 400 | 600 |
In this example—which uses made-up but, I bet, conservative data—after four hours, the players still have $56,844, the casino has $43,156, and from the total amount of money available, the casino took 43.16 percent. That’s somewhat more than the official 5.26 percent house edge.
It is human behavior—the tendency of players to keep playing—not the probabilities associated with a particular game, that makes gambling so profitable for casinos. Because the house rules are published and reported, statisticians can figure the house edge for any particular game.
Casinos are not required to report the actual money they take in from table games, however. Based on the depth of the shag carpet at Lum’s Travel Inn of Laughlin, Nevada (my favorite casino), though, I’m guessing casinos do okay. The general gambler’s hack here is to walk away after a certain period of time, whether you are ahead or behind. If you are lucky enough to get far ahead before your time runs out, consider running out of the casino.
Systems
There are several general betting systems based on money management and changing the amount of your standard wager. The typical system suggests increasing your bet after a loss, though some systems suggest increasing your bet after a win. As all these systems assume that a streak, hot or cold, is always more likely to end than continue, they are somewhat based on the gambler’s fallacy. Even when such systems make sense mathematically, though, anytime wagers must increase until the player wins, the law of finite pocket size sabotages the system in the long run.
Here’s a true story. On my first visit to a legal gambling establishment as a young adult, I was eager to use a system of my own devising. I noticed that if I bet on a column of 12 numbers at roulette, I would be paid 2 to 1. That is, if I bet $10 and won, I would get my $10 back, plus another $20. Of course, the odds were against any of my 12 numbers coming up, but if I bet on two sets of 12 numbers, then the odds were with me. I had a 24 out of 36 (okay, really 38) chance of winning—better than 50 percent!
I understood, of course, that I wouldn’t triple my money by betting on two sets of numbers. After all, I would lose half my wager on the set of 12 that didn’t come up. I saw that if I wagered $20, about two-thirds of the time I would win back $30. That would be a $10 profit. Furthermore, if I didn’t win on the first spin of the wheel, I would bet on the same numbers again, but this time I would double my bets! (I am a super genius, you agree?) If by some slim chance I lost on that spin as well, I would double my bet one more time, and then win all my money back, plus make that 50 percent profit. To make a long story short, I did just as I planned, lost on all three spins and had no money left for the rest of the long weekend and the 22-hour drive home.
The simplest form of this sort of system is to double your bet after each loss, and then whenever you do win (which you are bound to do), you are back up a little bit. The problem is that it is typical for a long series of losses to happen in a row; these are the normal fluctuations of chance. During those losing streaks, the constant doubling quickly eats up your bankroll.
Table 4-2 shows the results of doubling after just six losses in a row, which can happen frequently in blackjack, roulette, craps, video poker, and so on.
| Loss number | Bet size | Total expenditure |
| 1 | $5 | $5 |
| 2 | $10 | $15 |
| 3 | $20 | $35 |
| 4 | $40 | $75 |
| 5 | $80 | $155 |
| 6 | $160 | $315 |
Six losses in a row, even under an almost 50/50 game such as betting on a color in roulette, is very likely to happen to you if you play for more than just a couple of hours. The actual chance of a loss on this bet for one trial is 52.6 percent (20 losing outcomes divided by 38 possible outcomes). For any six spins in a row, a player will lose all spins 2.11 percent of the time (.526x.526x.526x.526x.526x.526).
Imagine 100 spins in two hours of play. A player can expect six losses in a row to occur twice during that time. Commonly, then, under this system, a player is forced to wager 32 times the original bet, just to win an amount equal to that original bet. Of course, most of the time (52.6 percent), when there have been six losses in a row, there is then a seventh loss in a row!
Systems do exist for gambling games in which players can make informed strategic decisions, such as blackjack (with card counting) and poker (reading your opponent), but in games of pure chance, statisticians have learned to expect the expected.
Know When to Hold ‘Em
In Texas Hold ‘Em, the “rule of four” uses simple counting to estimate the chance that you are going to win all those chips.
Texas Hold ‘Em No Limit Poker is everywhere. As I write this, I could point my satellite dish to ESPN, ESPN2, ESPN Classics, FOX Sports, Bravo, or E! and see professional poker players, lucky amateurs, major celebrities, minor celebrities, and even (Lord help us, on the Speed channel) NASCAR drivers playing this simple game.
You probably play yourself, or at least watch. The most popular version of the game is simple. All players start with the same amount of chips. When their chips are gone, so are they. Every round, players get two cards each that only they (and the patented tiny little poker table cameras) see. Then, three community cards are dealt face up. This is the flop. Another community card is then dealt face up. That’s the turn. Finally, one more community card, the river, is dealt face up. Betting occurs at each stage. Players use any five of the seven cards (five community cards, plus the two they have in their hands) to make the best five-card poker hand they can. The best hand wins.
Because some cards are face up, players have information. They also know which cards they have in their own hands, which is more information. They also know the distribution of all cards in a standard 52-card deck. All this information about a known distribution of values [Hack #1] makes Texas Hold ‘Em a good opportunity to stat hack all over the place [Hacks #36 and #38].
One particularly crucial decision point is the round of betting right after the flop. There are two more cards to come that might or might not improve your hand. If you don’t already have the nuts (the best possible hand), it would be nice to know what the chances are that you will improve your hand on the next two cards. The rule of four allows you to easily and fairly accurately estimate those chances.
How It Works
The rule of four works like this. Count the number of cards (without moving your lips) that could come off of the deck that would help your hand. Multiply that number by four. That product will be the percent chance that you will get one or more of those cards.
Example 1
You have a Jack of Diamonds and a Three of Diamonds. The flop comes King of Clubs, Six of Diamonds, and Ten of Diamonds. You have four cards toward a flush, and there are nine cards that would give you that flush. Other cards could help you, certainly (a Jack would give you a pair of Jacks, for example), but not in a way that would make you feel good about your chances of winning.
So, nine cards will help you. The rule of four estimates that you have a 36 percent chance of making that flush on either the turn or the river (9x4 = 36). So, you have about a one out of three chance. If you can keep playing without risking too much of your stack, you should probably stay in the hand.
Example 2
You have an Ace of Diamonds and a Two of Clubs. The flop brings the King of Hearts, the Four of Spades, and the Seven of Diamonds. You could count six cards that would help you: any of the three Aces or any of the three Twos. A pair of twos would likely just mean trouble if you bet until the end, so let’s say there are three cards, the Aces, that you hope to see. You have just a 12 percent chance (3x4 = 12). Fold ‘em.
Why It Works
The math involved here rounds off some important values to make the rule simple. The thinking goes like this. There are about 50 cards left in the deck. (More precisely, there are 47 cards that you haven’t seen). When drawing any one card, your chances of drawing the card you want [Hack #3] is that number divided by 50.
Tip
I know, it’s really 1 out of 47. But I told you some things have been simplified to make for the simple mnemonic “the rule of four.”
Whatever that probability is, the thinking goes, it should be doubled because you are drawing twice.
Tip
This also isn’t quite right, because on the river the pool of cards to draw from is slightly smaller, so your chances are slightly better.
For the first example, the rule of four estimates a 36 percent chance of making that flush. The actual probability is 35 percent. In fact, the estimated and actual percent chance using the rule of four tends to differ by a couple percentage points in either direction.
Other Places It Works
Notice that this method also works with just one card left to go, but in that case, the rule would be called the rule of two. Add up the cards you want and multiply by two to get a fairly accurate estimate of your chances with just the river remaining. This estimate will be off by about two percentage points in most cases, so statistically savvy poker players call this the rule of two plus two.
Where It Doesn’t Work
The rule of four will be off by quite a bit as the number of cards that will help you increases. It is fairly accurate with 12 outs (cards that will help), where the actual chance of drawing one of those cards is 45 percent and the rule of four estimate is 48 percent, but the rule starts to overestimate quite a bit when you have more than 12 cards that can help your hand.
To prove this to yourself without doing the calculations, imagine that there are 25 cards (out of 47) that could help you. That’s a great spot to be in (and right now I can’t think of a scenario that would produce so many outs), but the rule of four says that you have a 100 percent chance of drawing one of those cards. You know that’s not right. After all, there are 22 cards you could draw that don’t help you at all. The real chance is 79 percent. Of course, making a miscalculation in this situation is unlikely to hurt you. Under either estimate, you’d be nuts to fold.
Know When to Fold ‘Em
In Texas Hold ‘Em, the concept of pot odds provides a powerful tool for deciding whether to call or fold.
If you watch any poker on TV, you quickly pick up a boatload of jargon. You’ll hear about big slick and bullets and all-in and tilt. You’ll also hear discussions about pot odds, as in, “He might call here, not because he thinks he has the best hand, but because of the pot odds.”
When the pot odds are right, you should call a hand even when the odds are that you will lose. So, what are pot odds and why would I ever put more money into a pot that I am likely to lose?
Pot Odds
Pot odds are determined by comparing the chance that you will win the pot to the amount of chips you would win if you did win the pot. For example, if you estimate that there is a 50 percent chance that you will win a pot, but the pot is big enough that winning it would win you more than double the cost of calling the bet in front of you, then you should call.
To see how pot odds works in practice, here is a scenario with four players: Thelma, Louise, Mike, and Vince. As shown in Table 4-3, Thelma is in the best shape before the flop.
Tip
The tables that follow show the decisions each player makes based on the pot odds at each point in a round. Read the following tables left to right, following each column all the way down, to see what Thelma thinks and does, then what Louise thinks and does, and so on.
| Player | Thelma | Louise | Mike | Vince |
| Cards | Ace Clubs, Ace Hearts | 2 Clubs, 4 Clubs | 4 Hearts, 5 Spades | King Diamonds, 10 Diamonds |
| Opening bet | 50 | 50 | 50 | 50 |
Then comes the flop: Ace Spades, 3 Diamonds, 6 Diamonds. Table 4-4 shows the revised analysis of the players’ positions. After the flop, three of them are hoping to improve their hands, while one of them, Thelma, would be satisfied with no improvement of her hand, thinking she has the best one now. Thelma is driving the betting, and the other three players are deciding whether to call.
| Player | Thelma | Louise | Mike | Vince |
| Needed cards | Any of four 5s | Any of four 2s or four 7s | Any of nine diamonds | |
| Chance of getting card | 16 percent | 32 percent | 36 percent | |
| Current pot | 200 | 250 | 250 | 300 |
| Cost to call as percentage of pot | 20 percent | 20 percent | 17 percent | |
| Action | Bet 50 | Fold | Call 50 | Call 50 |
Table 4-4 shows the use of pot odds after the flop. Thelma has a pair of aces to start and hits the third ace on the flop. Consequently, she begins each round by betting. The other players who have yet to hit anything must decide whether to stick around and hope to improve their hands into strong, likely winners.
Pot odds come into play primarily when making the decision whether to stick around or fold. Louise needs a five to make her straight, and she estimates a 16 percent chance of getting that 5 somewhere in the next two cards. However, with that pot currently at $250 and a $50 raise from Thelma, which she would have to call, Louise would have to pay 20 percent of the pot. This is a 20 percent cost compared with a 16 percent chance of winning the pot. The risk is greater than the payoff, so Louise folds. Mike and Vince, however, have more outs, so pot odds dictate that they stick around.
Then comes the turn: the Jack of Clubs. As shown in Table 4-5, after the turn, with only one card left to go, Mike’s pot odds are no longer better than his chances of drawing a winning card, and he folds. Though Vince starts out with a potentially better hand than Mike, he too eventually folds when the pot odds indicate he should.
| Player | Thelma | Louise | Mike | Vince |
| Needed cards | Same as before | Same as before | ||
| Chance of getting card | 18 percent | 20 percent | ||
| Current pot | 350 | 450 | 450 | |
| Cost to call as percentage of pot | 22 percent | 22 percent | ||
| Action | Bet 100 | Fold | Fold |
Let’s assume that the players are using only pot odds to make their decisions, ignoring for the sake of illustration that they are probably trying to get a read on the other players (e.g., who could bluff, raise, and so on). By the way, players are calculating the chance that they will get a card to improve their hand using the rule of four and the rule of 2 + 2 [Hack #36].
Why It Works
Imagine a game that costs a dollar to play. Pretend the rules are such that half the time you will win and get paid three dollars. The other half of the time you would lose one dollar and gain two dollars. Over time, if you kept playing this crazy game, you would make a whole lot of money.
It is the same sort of thinking that governs the use of pot odds in poker. With a 36 percent chance of making a flush, a perfectly fair bet would be to wager 36 percent of the pot. You would get your flush 36 percent of the time and break even over the long run. If you could play a game in which you could pay less than 36 percent of the pot and still win 36 percent of the time in the long run, you should play that crazy game, right? Well, every time you find yourself in a situation in which the pot odds are better than the proportion of the pot you have to wager, you have an opportunity to play just such a crazy game. Trust the statistics. Play the crazy game.
Where Else It Works
Experienced players not only make use of pot odds to make decisions about folding their hands, but they even make use of a slightly more sophisticated concept known as implied pot odds. Implied pot odds are based not on the proportion of the current pot that a player must call, but on the proportion of the pot total when the betting is completed for that betting round.
If players have yet to act, a player who is undecided about whether to stay in based on pot odds might expect other players to call down the line. This increases the amount of the final pot, increases the amount the player would win if she hit one of her wish cards, and increases the actual pot odds when all the wagering is done.
The phrase "implied pot odds” is also sometimes used to refer to the relative cost of betting compared to the final, total pot after all rounds of betting have been completed. I have also heard the term “pot odds” used to describe the idea that if you happen to " hit the nuts” (get a strong hand that’s unlikely to be beaten) or close to it, then you are likely to win a pot much bigger than the typical pot. Some players spend a lot of energy and a lot of calls just hoping to hit one of these super hands and really clean up.
Implied pot odds works like this. In the scenario in Table 4-3, Mike might have called after Fourth Street (the fourth card revealed), anticipating that Vince would also call. This would have increased the final pot to 650, making Mike’s contribution that round only 15 percent and justifying his call.
Interestingly, if Vince had been betting into a slightly larger pot that contained Mike’s call, the pot odds for Vince’s 100-chip call would then have dropped to 18 percent and Vince might have called. In fact, if Mike were a super genius-type player, he well could have called on the turn knowing that would change the pot odds for Vince and therefore encourage him to call. Real-life professional poker players—who are really, really good—really do think that way sometimes.
Where It Doesn’t Work
Remember that pot odds are based on the assumption that you will be playing poker for an infinite amount of time. If you are in a no-limit tournament format, though, where you can’t dig into your pockets, you might not be willing to risk all or most of your chips on your faith about what will happen in the long run.
The other problem with basing life and death decisions on pot odds is that you are treating a “really good hand” as if it were a guaranteed winner. Of course, it’s not. The other players may have really good hands, too, that are better than yours.
Know When to Walk Away
In Texas Hold ‘Em, when you are “short-stacked,” you have only a couple of choices: go all-in right now or go all-in very soon. As you might have guessed, knowing when to make your last stand is all about the odds.
I hear the TV poker commentators talking about how “easy” it is in Texas Hold ‘Em tournaments to play when you are short-stacked. They mean it is easy because you don’t have many options from which to choose.
The term “short-stacked” can be used in a couple of different ways. Sometimes, it is used to refer to whoever has the fewest chips at the table. Under this use of the term, even if you have thousands of chips and can afford to pay a hundred antes and big blinds, you are short-stacked if everyone else has more chips.
A better definition, which is more applicable to statistics-based decision making, is that you are short-stacked when you can only afford to pay the antes and blinds for a few more times around the table. Under this definition, there is mounting pressure to bet it all and hope to double or triple up and get back in the game. I prefer this use of the term because without pressure to play, being “short-stacked” is not a particularly meaningful situation.
It doesn’t feel easy, though, does it, when you are short-stacked and have to go all-in (bet everything you have)? It feels very, very hard for two reasons:
You are probably not going to win the tournament. You realize that you are down to very few chips and would have to double up several times to get back in the game. Realistically, you doubt that you have much of a chance. That’s depressing, and any decision you make when you are sad is difficult.
One mistake and you are out. There is little margin for error, and it is hard to pull the trigger in such a high-stakes situation.
Applying some basic statistical principles to the decision might help make you feel better. At least you’ll have some nonemotional guidelines to follow. When you lose (and you still probably will; you’re short-stacked, after all), now you can blame me, or the fates, and not yourself.
Recognizing a Short-Stacked Situation
In tournament settings, at some point you often will have so few chips that you will run out soon. Unless you bet and win soon, you will be blinded out—the cost of the mandatory bets will bleed you dry.
How few chips must you have to be short-stacked? Even if we define short-stacked as having some multiple of the big blind (the larger of two forced bets that you must make on a rotating basis), how many of those big blinds you need is a matter of style, and there is no single correct number. Here are some different perspectives on how many chips you must have in front of you to consider yourself short-stacked.
Twelve times the big blind or less
Though you could play quite a while longer without running out of chips, you will want to bet on any decent hand. You hope to win some blinds here. The more blinds you win, the longer you can wait for killer hands. If you are raised, at least consider responding with an all-in.
Players who start to think of themselves as short-stacked in this position wish to go all-in now on a good hand, rather than being forced to go all-in on a mediocre hand later on. Another advantage of starting to take risks is that an announcement of “all-in” will still pull some weight here. You will have enough chips to make someone think twice before they call you. Later on, your miserable little stack won’t be enough to push anyone around.
Tip
Choose your opponent wisely, if you can, when you go all-in and want a fold in response. Your raise of all-in against another small stack will be much more powerful than the same tactic against a monster stack. By the same token, if you want a call, don’t hesitate to go all-in against players with tons of chips. They will be more than happy to double you up.
Eight times the big blind or less
In any position, whether you are on the button, in the big blind, or the first to bet, consider announcing all-in with any top-10 hand. You still have enough chips here to scare off some players, especially those with similarly sized stacks.
You are starting to get low enough, though, that you really want to be called. If you can play some low pairs cheaply, try it, but bail out if you don’t get three of a kind in the flop. You need to keep as many big blinds as you can to coast on until you get that all-in opportunity.
Here are the 10 hands that are the most likely to double you up:
A pair of Aces, Kings, Queens, Jacks, or 10s
Ace-King, Ace-Queen, Ace-Jack, or King-Queen of the same suit
Ace-King of different suits
Four times the big blind or less
At this point, you need to go all-in, even on hands that have a more than 50 percent chance of losing. Purposefully making a bad wager seems counterintuitive, but you are fighting against the ever-shrinking base amount you hope to double up. If you wait and wait until you have close to a sure thing, whatever stack remains will have to be doubled a few extra times to get you back.
A form of pot odds [Hack #37] kicks in at this point. If you pass up a 25 percent chance of winning while waiting for a 50 percent chance, you might be able to win only half as much when (and if) you ever get to play the better hand. Definitely go all-in on any pair, an Ace and anything else, any face card and a good kicker, or suited connectors.
Tip
A good rule of thumb when you’re very, very short-stacked (i.e., your total chips are fewer than four times the big blind) is to bet it all as soon as you get a hand that adds up to 18 or better. Kings count as 13, Queens 12, Jacks 11, and the rest are their face value. Aces count as 14, but you are already going all-in with an Ace-anything, so that doesn’t matter. Eighteen-point hands include 10-8, Jack-7, Queen-6, and King-5.
Statistical Decision Making
The statistical question that determines when you should make your move—whether it is announcing all-in or, at least, making a decision to be pot committed (so many chips in the pot that you will go all-in if pushed)—is, “Am I likely to get a better hand before I run out of chips?”
I’m going to group 50 decent, playable starting Texas Hold ‘Em poker hands, hands that give you a chance to win against a small number of opponents. I’ll be using three groupings, shown in Tables 4-6, 4-7, and 4-8. While different poker experts might quibble a bit about whether a given hand is good or just okay, most would agree that these hands are all at least playable and should be considered when short-stacked.
Tip
By the way, these hands are not necessarily in order of quality within each grouping.
| Pairs | Same suit | Different suits |
| Ace-AceKing-KingQueen-QueenJack-Jack10-10 | Ace-King Ace-Queen Ace-Jack King-Queen | Ace-King |
| Pairs | Same suit | Different suits |
| 9-98-87-7 | Ace-Ten King-Jack King-10Queen-JackQueen-10Jack-10Jack-910-99-8 | Ace-QueenAce-JackKing-Queen |
| Pairs | Same suit | Different suits |
| 6-65-5 | Ace-9Ace-8Ace-7Ace-6Ace-5Ace-4Ace-3Ace-2King-9Queen-910-89-78-78-67-66-55-4 | Ace-10King-JackQueen-JackKing-10Queen-10Jack-10 |
When you are short-stacked and the blinds and antes are coming due, you know you have a certain number of hands left before you have to make a move. Table 4-9 shows the probability that you will be dealt a great, good, or okay hand over the next certain number of deals.
| Hand quality | Next hand | In 5 deals | In 10 deals | In 15 deals | In 20 deals |
| Great | 4 percent | 20 percent | 36 percent | 49 percent | 59 percent |
| Good | 7 percent | 29 percent | 50 percent | 65 percent | 75 percent |
| Okay | 11 percent | 46 percent | 70 percent | 84 percent | 91 percent |
| Okay or better | 22 percent | 72 percent | 92 percent | 98 percent | 99 percent |
Tip
I calculated the probabilities for Table 4-9 by first figuring the probabilities for any specific pair (you are just as likely to get a pair of Aces as a pair of 2s): .0045. I then figured the probabilities for getting any two specific different cards that are the same suit (.003), and the chances of getting any two specific different cards that are not the same suit (.009). Then, for each category—great, good, or okay—I multiplied the appropriate probability by the number of pairs, unpaired suited hands, and so on, in that category. I then calculated the chance of one of these hands not hitting across the given number of opportunities and subtracted that value from 1 to get the values for each cell in the table.
Here is how to use Table 4-9. Imagine you are short-stacked and have just been dealt a good hand. If you think you really have to go all-in sometime during the next five hands, there is only a 20 percent chance that you will be dealt a better hand. You should probably stake everything on this good hand.
If you can hang on for 20 more deals, there is a greater than 50 percent chance that you will get a gangbuster hand, so if you want to be conservative, you can lay these cards down for now. More commonly, short-stacked players consider going all-in with a hand that is not even a top-50 hand—something like King-8 unsuited, for example. Using the probabilities in Table 4-9, you might safely lay it down and hope for a better hand in the next five hands. There is a 72 percent chance you will get it.
Finally, imagine that you have just a few hands left because the blinds are shrinking your stack down to nothing. You look down and see a decent hand, an okay hand, such as 8-7 in the same suit. Table 4-9 allows you to answer the big question: is it likely that your very next hand will be better than this one? There is about an 11 percent chance of getting a good or great hand next. So, no, it is unlikely you will improve. Stake your future on this hand.
Getting Your Mind Right
We talked earlier about why it is so emotionally difficult to play when short-stacked. Here are some psychological tips to fight the pain of being caught between a rock and a hard place:
- Be realistic
In blackjack, when a player hits her 16 against the dealer’s 7, she knows she is likely to bust. She does it anyway because the dealer is likely to have a 10-card down, and it gives her the best chances in an almost no-win situation. She takes pleasure in knowing she did all she could to give herself the best chances of surviving. The same thinking applies here: take pleasure in knowing you gave yourself the best chances to come back and win.
- Enjoy the all-in experience
There is nothing more exciting than having it all on the line. Because you had no real choice about going all-in, just relax and enjoy it the best you can. No player will chide you about doing “such a stupid thing,” because you just did the smartest thing you could.
- Take control
To avoid feeling forced to do something you don’t want to do, start your comeback attempt before you have to. Play to avoid the short-stacked situation by starting to make your moves when you still have 10 to 12 times the big blind in chips. You have a lot more choices at this point than you will have later on, and so you can play with more subtlety, basing your bet on position, opponents, tells, and so on. The smaller your stack gets, the less power you have to control your own destiny.
Lose Slowly at Roulette
Roulette has so many pretty colors and shiny objects that kittens love it. Plus, you’ll look pretty cool playing it. But in the long run, you’ll lose money, and with your cat allergy and all....
Like most games in a casino, roulette is a game of pure chance. No one has any skill when it comes to predicting which of the 37 (European-style) or 38 (U.S.-style) partitioned sections the tiny ball will end up in. The best a player can do is know the odds, manage his money, and assume going in that he will lose.
Of course, he might get lucky and win some money, which would be dandy, but the Law of Big Numbers [Hack #2] must be obeyed. In the long run, he is most likely to have less money than if he had never played at all. In fact, if he plays an infinite amount of time, he is guaranteed to lose money. (Most roulette players play for a period of time somewhat less than infinity, of course.) To extend your amount of playing time, there is important statistical information you should know about this game with the spinning wheel, the orbiting ball, and the black and red layout.
Basic Wagers
Figure 4-1 shows the betting layout of a typical roulette game. This is an American-style layout, which means there are two green numbers, 0 and 00, which do not pay off any bets on red and black or odd and even. European-style roulette wheels have only one green number, 0, which cuts in half the house advantage compared to U.S. casinos.
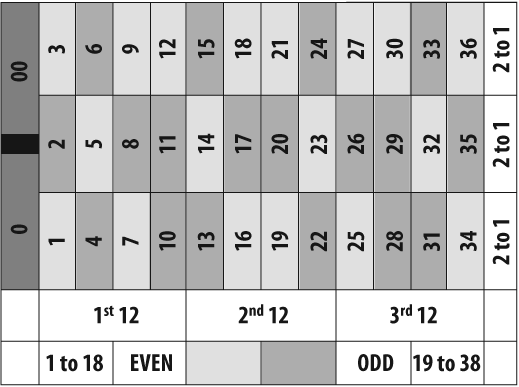
Players can bet in a large variety of ways, which is one reason roulette is so popular in casinos. For example, a player could place one chip over a single number, touching two numbers, on a color, adjacent to a column of 12 numbers, and so on. Like any other probability question, the chance of randomly getting the desired outcome is a function of the number of desired outcomes (winning) divided by the total number of outcomes.
There are 38 spaces on the wheel and, because all 38 possible outcomes are equally likely, the calculations are fairly straightforward. Table 4-10 shows the types of bets players can make, the information necessary to calculate the odds of winning for a single spin of the wheel and a one-dollar bet, the actual amounts the casino pays out, and the house advantage.
The house advantage is figured by first determining what the casino should pay back for each dollar bet if there were no advantage to the casino. The fair payback would be to give the winner an amount of money equal to the risk taken. The amount of risk taken is, essentially, the number of possible losing outcomes. This actual amount paid to the winner is then subtracted from the amount that should be paid if there were no house advantage. These “extra” dollars that the house keeps is divided by the proportion of total outcomes to winning outcomes. If there are no extra dollars, the game is evenly matched between player and casino and the house edge is 0 percent.
If you study the statistics of roulette in Table 4-10, a couple of conclusions are apparent. First, the casino makes its profit by pretending that there are only 36 numbers on a roulette wheel (i.e., only 36 possible outcomes) and pays out using that pretend distribution.
Second, regardless of the type of wager that is made at a roulette wheel, the house edge is a constant 5.26 percent. This is true except for one obscure wager, which is allowed at most casinos. Players are often allowed to bet on the two zeros and their adjacent numbers, 1, 2 and 3, for a total of five numbers. This is done by placing a chip to the side, touching both the 0 and the 1. I’d tell you more about checking with the person who spins the wheel to make sure they take this wager, and so on, except that this is the worst bet at the roulette table and no statistician would advise it. Casinos who allow this bet pay out as if it were a bet on six numbers. So, the casino’s usual edge of 5.26 percent is even larger here: 7.89 percent, as shown in Table 4-11.
Why It Works
Roulette’s popularity is based partly on the fact that so many different types of wagers are possible. A gambler with a lot of chips can spread them out all over the table, with a wide variety of different bets on different numbers and combinations of numbers. As long as she avoids the worst bet at the table (five numbers), she can rest assured that the advantage to the house will be the same honest 5.26 percent for each of her bets. It is one less thing for the gambler to worry about.
The fact that there is such a large variety of bets that can be placed on a single layout is no lucky happenstance, though. The decision to use 36 numbers was a wise one, and no doubt it was made all those years ago because of the large number of factors that go into 36. Thirty-six can be evenly divided by 1, of course, but also by 2, 3, 4, 6, 9, 12, and 18, making so many simple bets possible.
Play in the Black in Blackjack
Perhaps the most potentially profitable application of statistics hacking is at the blackjack table.
In blackjack, the object of the game is to get a hand of cards that is closer to totaling 21 points (without going over) than the dealer’s cards. It’s a simple game, really. You start with two cards and can ask for as many more as you would like. Cards are worth their face value, with the exception of face cards, which are worth 10 points, and Aces, which can be either 1 or 11.
You lose if you go over 21 or if the dealer is closer than you (without going over). The bets are even money, with the exception of getting a blackjack: two cards that add up to 21. Typically, you get paid 3-to-2 for hitting a blackjack. The dealer has an advantage in that she doesn’t have to act until after you. If you bust (go over 21), she wins automatically.
Statisticians can play this game wisely by using two sources of information: the dealer’s face-up card and the knowledge of cards previously dealt. Basic strategies based on probability will let smart players play almost even against the house without having to pay much attention or learn complicated systems. Methods of taking into account previously dealt cards are collectively called counting cards, and using these methods allows players to have a statistical advantage over the house.
Tip
U.S. courts have ruled that card counting is legal in casinos, though casinos wish you would not do it. If they decide that you are counting cards, they might ask you to leave that game and play some other game, or they might ban you from the casino entirely. It is their right to do this.
Basic Strategy
First things first. Table 4-12 presents the proper basic blackjack play, depending on the two-card hand you are dealt and the dealer’s up card. Most casinos allow you to split your hand (take a pair and split it into two different hands) and double down (double your bet in exchange for the limitation of receiving just one more card). Whether you should stay, take a card, split, or double down depends on the likelihood that you will improve or hurt your hand and the likelihood that the dealer will bust.
| Your hand | Hit | Stay | Double down | Split |
| 5-8 | Always | |||
| 9 | 2, 7-A | 3-6 | ||
| 10-11 | 10 or A | 2-9 | ||
| 12 | 2, 3, 7-A | 4-6 | ||
| 13-16 | 7-A | 2-6 | ||
| 17-20 | Always | |||
| 2, 2 | 8-A | 2-7 | ||
| 3, 3 | 2, 8-A | 3-7 | ||
| 4, 4 | 2-5, 7-A | 6 | ||
| 5, 5 | 10 or A | 2-9 | ||
| 6, 6 | 7-A | 2-6 | ||
| 7, 7 | 8-A | 2-7 | ||
| 8, 8 | Always | |||
| 9, 9 | 2-6, 8, 9 | 7, 10, A | ||
| 10, 10 | Always | |||
| A, A | Always | |||
| A, 2 | 2-5, 7-A | 6 | ||
| A, 3 or A, 4 | 2-4, 7-A | 5 or 6 | ||
| A, 5 | 2 or 3, 7-A | 4-6 | ||
| A, 6 | 2, 7-A | 3-6 | ||
| A, 7 | 9-A | 2, 7-A | 3-6 | |
| A, 8 or 9 or 10 | Always |
Tip
In Table 4-12, “Your hand” is the two-card hand you have been dealt. For example, “5-8” means your two cards total to a 5, 6, 7, or 8. “A” means Ace. A blank table cell indicates that you should never choose this option, or, in the case of splitting, that it is not even allowed.
The remaining four columns present the typical options and what the dealer’s card should be for you to choose each option. As you can see, for most hands there are only a couple of options that make any statistical sense to choose. The table shows the best move, but not all casinos allow you to double-down on just any hand. Most, however, allow you to split any matching pair of cards.
Why It Works
The probabilities associated with the decisions in Table 4-12 are generated from a few central rules:
The dealer is required to hit until she makes it to 17 or higher.
If you bust, you lose.
If the dealer busts and you have not, you win.
The primary strategy, then, is to not risk busting if the dealer is likely to bust. Conversely, if the dealer is likely to have a nice hand, such as 20, you should try to improve your hand. The option that gives you the greatest chance of winning is the one indicated in Table 4-12.
Tip
The recommendations presented here are based on a variety of commonly available tables that have calculated the probabilities of certain outcomes occurring. The statistics have either been generated mathematically or have been produced by simulating millions of blackjack hands with a computer.
Here’s a simple example of how the probabilities battle each other when the dealer has a 6 showing. The dealer could have a 10 down. This is actually the most likely possibility, since face cards count as 10. If there is a 10 down, great, because if the dealer starts with a 16, she will bust about 62 percent of the time (as will you if you hit a 16).
Since eight different cards will bust a 16 (6, 7, 8, 9, 10, Jack, Queen, and King), the calculations look like this:
| 8/13 = .616 |
Of course, even though the single best guess is that the dealer has a 10 down, there is actually a better chance that the dealer does not have a 10 down. All the other possibilities (9/13) add up to more than the chances of a 10 (4/13).
Any card other than an Ace will result in the dealer hitting. And the chances of that next card breaking the dealer depends on the probabilities associated with the starting hand the dealer actually has. Put it all together and the dealer does not have a 62 percent chance of busting with a 6 showing. The actual frequency with which a dealer busts with a 6 showing is closer to 42 percent, meaning there is a 58 percent chance she will not bust.
Now, imagine that you have a 16 against the dealer’s down card of 6. Your chance of busting when you take a card is 62 percent. Compare that 62 percent chance of an immediate loss to the dealer’s chance of beating a 16, which is 58 percent. Because there is a greater chance that you will lose by hitting than that you will lose by not hitting (62 is greater than 58), you should stay against the 6, as Table 4-12 indicates.
All the branching possibilities for all the different permutations of starting hands versus dealers’ up cards result in the recommendations in Table 4-12.
Simple Card-Counting Methods
The basic strategies described earlier in this hack assume that you have no idea what cards still remain in the deck. They assume that the original distribution of cards still remains for a single deck, or six decks, or whatever number of decks is used in a particular game. The moment any cards have been dealt, however, the actual odds change, and, if you know the new odds, you might choose different options for how you play your hand.
Elaborate and very sound (statistically speaking) methods exist for keeping track of cards previously dealt. If you are serious about learning these techniques and dedicating yourself to the life of a card counter, more power to you. I don’t have the space to offer a complete, comprehensive system here, though. For the rest of us, who would like to dabble a bit in ways to increase our odds, there are a few counting procedures that will improve your chances without you having to work particularly hard or memorize many charts and tables.
The basic method for improving your chances against the casino is to increase your wager when there is a better chance of winning. The wager must be placed before you get to see your cards, so you need to know ahead of time when your odds have improved. The following three methods for knowing when to increase your bet are presented in order of complexity.
Counting Aces
You get even money for all wins, except when you are dealt a blackjack. You get a 3-to-2 payout (e.g., $15 for every $10 bet) when a blackjack comes your way. Consequently, when there is a better-than-average chance of getting a blackjack, you would like to have a larger-than-average wager on the line.
The chances of getting a blackjack, all things being equal, is calculated by summing two probabilities:
- Getting a 10-card first and then an Ace
4/13x4/51 = .0241
- Getting an Ace first and then a 10-card
1/13x16/51 = .0241
Add the two probabilities together, and you get a .0482 (about 5 percent) probability of being dealt a natural 21.
Obviously, you can’t get a blackjack unless there are Aces in the deck. When they are gone, you have no chance for a blackjack. When there are relatively few of them, you have less than the normal chance of a blackjack. With one deck, a previously dealt Ace lowers your chances of hitting a blackjack to .0362 (about 3.6 percent). Dealing a quarter of the deck with no Aces showing up increases your chances of a blackjack to about 6.5 percent.
Tip
Quick tip for the budding card counter: don’t move your lips.
Counting Aces and 10s
Of course, just as you need an Ace to hit a blackjack, you also need a 10-card, such as a 10, Jack, Queen, or King. While you are counting Aces, you could also count how many 10-cards go by.
There is a total of 20 Aces and 10-cards, which is about 38 percent of the total number of cards. When half the deck is gone, half of those cards should have been shown. If fewer than 10 of these key cards have been dealt, your chances of a blackjack have increased. With all 20 still remaining halfway through a deck, your chances of seeing a blackjack in front of you skyrockets to 19.7 percent.
Going by the point system
Because you want proportionately more high cards and proportionately fewer low cards when you play, a simple point system can be used to keep a running “count” of the deck or decks. This requires more mental energy and concentration than simply counting Aces or counting Aces, 10s, and face cards, but it provides a more precise index of when a deck is loaded with those magic high cards.
Table 4-13 shows the point value of each card in a deck under this point system.
| Card | Point value |
| 10, Jack, Queen, King, Ace | -1 |
| 7, 8, 9 | 0 |
| 2, 3, 4, 5, 6 | +1 |
A new deck begins with a count of 0, because there are an equal number of -1 cards and +1 cards dealt in the deck. Seeing high cards is bad, because your chances of blackjacks have dropped, so you lose a point in your count. Spotting low cards is good, because there are now proportionately more high cards in the deck, so you gain a point there.
Tip
You can learn to count more quickly and easily by learning to rapidly recognize the total point value of common pairs of cards. Pairs of cards with both a high card and a low card cancel each other out, so you can quickly process and ignore those sorts of hands. Pairs that are low-low are worth big points (2), and pairs that are high-high are trouble, meaning you can subtract 2 points for each of these disappointing combinations.
You will only occasionally see runs of cards that dramatically change the count in the good direction. The count seldom gets very far from 0. For example, with a single new deck, the first six cards will be low less than 1 percent of the time, and the first ten cards will be low about 1/1000 of 1 percent of the time.
The count doesn’t have to be very high, though, to improve your odds enough to surpass the almost even chance you have just following basic strategy. With one deck, counts of +2 are large enough to meaningfully improve your chances of winning. With more than one deck, divide your count by the number of decks—this is a good estimation of the true count.
Sometimes you will see very high counts, even with single decks. When you see that sort of string of luck, don’t hesitate to raise your bet. If you get very comfortable with the point system and have read more about such systems, you can even begin to change the decisions you make when hitting or standing or splitting or doubling down.
Even if you just use these simple systems, you will improve your chances of winning money at the blackjack tables. Remember, though, that even with these sorts of systems, there are other pitfalls awaiting you in the casino, so be sure to always follow other good gambling advice [Hack #35] as well.
Play Smart When You Play the Lottery
Your odds of winning a big prize in a giant lottery are really, really small, no matter how you slice it. You do have some control over your fate, however. Here are some ways to give yourself an advantage (albeit slight) over all the other lotto players who haven’t bought this book.
In October of 2005, the biggest Powerball lottery winner ever was crowned and awarded $340 million. It wasn’t me. I don’t play the lottery because, as a statistician, I know that playing only slightly increases my chances of winning. It’s not worth it to me.
Of course, if I don’t play, I can’t win. Buying a lottery ticket isn’t necessarily a bad bet, and if you are going to play, there are a few things you can do to increase the amount of money you will win (probably) and increase your chances of winning (possibly). Whoever bought the winning $340 million ticket in Jacksonville, Oregon, that October day likely followed a few of these winning strategies, and you should too.
Because Powerball is a lottery game played in most U.S. states, we will use it as our example. This hack will work for any large lottery, though.
Powerball Odds
Powerball, like most lotteries, asks players to choose a set of numbers. Random numbers are then drawn, and if you match some or all of the numbers, you win money! To win the biggest prizes, you have to match lots of numbers. Because so many people play Powerball, many tickets are sold, and the prize money can get huge.
Of course, correctly picking all the winning numbers is hard to do, but it’s what you need to do to win the jackpot. In Powerball, you choose five numbers and then a sixth number: the red powerball. The regular white numbers can range from 1 to 55, and the powerball can range from 1 to 42. Table 4-14 shows the different combinations of matches that result in a prize, the amount of the prize, and the odds and probability of winning the prize.
| Match | Cash | Odds | Percentage |
| Powerball only | $3 | 1 in 69 | 1.4 percent |
| 1 white ball and the powerball | $4 | 1 in 127 | 0.8 percent |
| 3 white balls | $7 | 1 in 291 | 0.3 percent |
| 2 white balls and the powerball | $7 | 1 in 745 | 0.1 percent |
| 3 white balls and the powerball | $100 | 1 in 11,927 | 0.008 percent |
| 4 white balls | $100 | 1 in 14,254 | 0.007 percent |
| 4 white balls and the powerball | $10,000 | 1 in 584,432 | 0.0002 percent |
| 5 white balls | $200,000 | 1 in 3,563,609 | 0.00003 percent |
| 5 white balls and the powerball | Grand prize | 1 in 146,107,962 | 0.0000006 percent |
Powerball Payoff
Armed with all the wisdom you likely now have as a statistician (unless this is the first hack you turned to in this book), you might have already made a few interesting observations about this payoff schedule.
Easiest prize
The easiest prize to win is the powerball only match, and even then there are slim chances of winning. If you match the powerball (and no other numbers), you win $3. The chances of winning this prize are about 1 in 69.
This is not a good bet by any reasonable standard. It costs a dollar to buy a ticket, to play one time, and the expected payout schedule is $3 for every 69 tickets you buy. So, on average, after 69 plays you will have won $3 and spent $69.
Actually, your payoff will be a little better than that. The odds shown in Table 4-14 are for making a specific match and not doing any better than that. Some proportion of the time when you match the powerball, you will also match a white ball and your payoff will be $4, not $3. Choosing five white ball numbers and matching at least 1 will happen 39 percent of the time.
So, after having matched the powerball, you have a little better than a third chance of hitting at least one white ball as well. Even so, your expected payoff is about $3.39 for every $69 you throw down that rat hole (I mean, spend on the lottery), which is still not a good bet.
Powerball only
The odds for the powerball only match don’t seem quite right. I said there were 42 different numbers to choose from for the powerball, so shouldn’t there be 1 out of 42 chances to match it, not 1 in 69?
Yes, but remember this shows the chances of hitting that prize only and not doing better (by matching some other balls). Your odds of winning something, anything, if you combine all the winning permutations together are 1 in 37, about 3 percent. Still not a good bet.
Grand prize
The odds for the grand prize don’t seem quite right either. (Okay, okay, I don’t really expect you to have “noticed” that. I didn’t either until I did a few calculations.)
If there are 5 draws from the numbers of 1 to 55 (the white balls) and 1 draw from the numbers 1 to 42 (the red ball), then a quick calculation would estimate the number of possibilities as:
In other words, the odds are 1 out of 21,137,943,750. Or, if you were thinking a little more clearly, realizing that the number of balls gets smaller as they are drawn, you might speedily calculate the number of possible outcomes as:
But the odds as shown are somewhat better than 1 out of 1.7 billion. The first time I calculated the odds, I didn’t keep in mind that the order doesn’t matter, so any of the remaining chosen numbers could come up at any time. Hence, here’s the correct series of calculations:
Winning Powerball
OK, Mr. Big Shot Stats Guy (you are probably thinking), you’re going to tell us that we should never play the lottery because, statistically, the odds will never be in our favor. Actually, using the criteria of a fair payout, there is one time to play and to buy as many tickets as you can afford.
In the case of Powerball, you should play anytime the grand prize increases to past $146,107,962 (or double that amount if you want the lump sum payout). As soon as it hits $146,107, 963, buy, buy, buy! Because the chances of matching five white balls and the one red ball are exactly one out of that big number, from a statistical perspective, it is a good bet anytime your payout is bigger than that big number.
For Powerball and its number of balls and their range of values, 146,107,962 is the magic number. The idea that your chances of winning haven’t changed but the payoff amount has increased to a level where playing is worthwhile is similar to the concept of pot odds in poker [Hack #37].
Tip
You can calculate the “magic number" for any lottery. Once the payoff in that lottery gets above your magic number, you can justify a ticket purchase. Use the “correct series” of calculations in our example for Powerball as your mathematical guide. Ask yourself how many numbers you must match and what the range of possible numbers is. Remember to lower the number you divide by one each time you “draw” out another ball or number, unless numbers can repeat. If numbers can repeat, then the denominator stays the same in your series of multiplications.
One important hint about deciding when to buy lottery tickets has to do with determining the actual magic number, the prize amount, which triggers your buying spree. The amount that is advertised as the jackpot is not, in fact, the jackpot. The advertised “jackpot” is the amount that the winner would get over a period of years in a regular series of smaller portions of that amount. The real jackpot—the amount you should identify as the payout in the gambling and statistical sense—is the amount that you would get if you chose the one lump sum option. The one lump sum is typically a little less than half of the advertised jackpot amount.
So, if you have determined that your lottery has grown a jackpot amount that says it is now statistically a good time to play, how many tickets should you buy? Why not buy one of each? Why not spend $146,107,962 and buy every possible combination? You are guaranteed to win. If the jackpot is greater than that amount, then you’ll make money, guaranteed, right? Well, actually not. Otherwise, I’d be rich and I would never share this hack with you. Why wouldn’t you be guaranteed to win? The probably is that you might be forced to...wait for it...split the prize! Argh! See the next section...
Don’t Split the Prize
If you do win the lottery, you’d like to be the only winner, so in addition to deciding when to play, there are a variety of strategies that increase the likelihood that you’ll be the only one who picked your winning number.
First off, I’m working under the assumption that the winning number is randomly chosen. I tend not to be a conspiracy theorist, nor do I believe that God has the time or inclination to affect the drawing of winning lottery numbers, so I’m going to not list any strategy that would work only if there were not randomness in the drawing of lottery numbers. Here are some more reasonable tips to consider when picking your lottery numbers:
- Let the computer pick
Let the computer do the picking, or, at least, choose random numbers yourself. Random numbers are less likely to have meaning for any other player, so they are less likely to have chosen them on their own tickets. The Powerball people report that 70 percent of all winning tickets are chosen randomly by the in-store computer. (They also point out, in a bit of “We told you that results are random” whimsy that 70 percent of all tickets purchased had numbers generated by the computer.)
- Don’t pick dates
Do not pick numbers that could be dates. If possible, avoid numbers lower than 32. Many players always play important dates, such as birthdays and anniversaries, prison release dates, and so on. If your winning number could be someone’s lucky date, that increases the chance that you will have to split your winnings.
- Stay away from well-known numbers
Do not pick numbers that are well known. In the big October 2005 Powerball results, hundreds of players chose numbers that matched the lottery ticket numbers that play a large role in the popular fictional TV show Lost. None of these folks won the big prize, but if they had, they would have had to divide the millions into hundreds of slices.
Tip
There is also a family of purely philosophical tips that have to do with abstract theories of cause and effect and the nature of reality. For example, some philosophers would say to pick last week’s winning numbers. Because, while you might not know for sure what is real and what can and cannot happen in this world, you do know that, at least, it is possible for last week’s numbers to be this week’s winning numbers. It happened before; it can happen again.
Though your odds of winning a giant lottery prize are slim, you can follow some statistical principles and do a few things to actually control your own destiny. (The word for destiny in Italian, by the way, is lotto.) Oh, and one more thing: buy your ticket on the day of the drawing. If too much time passes between your purchase and the announcement of the winning numbers, you have a greater likelihood of being hit by lightning, drowning in the bathtub, or being struck by a minivan than you do of winning the jackpot. Timing is everything, and I’d hate for you to miss out.
Play with Cards and Get Lucky
While it is true that Uncle Frank spends much of his time in taverns using dice to win silly bar bets and smiling real charming-like at the ladies, there is more to his life than that. For instance, sometimes he uses playing cards instead of dice.
People, especially card players, and especially poker players, feel pretty good about their level of understanding of the likelihood that different combination of cards will appear. Their experience has taught them the relative rarity of pairs, three-of-a-kind, flushes, and so on. Generalizing that intuitive knowledge to playing-card questions outside of game situations is difficult, however.
My stats-savvy uncle, Uncle Frank, knows this. Sometimes, Uncle Frank uses his knowledge of statistics for evil, not good, I am sorry to say, and he has perfected a group of bar bets using decks of playing cards, which he claims helped pay his way through graduate school. I’ll share them with you only for the purpose of demonstrating certain basic statistical principles. I trust that you will use your newfound knowledge to entertain others, fight crime, or win inexpensive nonalcoholic beverages.
Getting a Li’l Flush
In poker, a flush is five cards, all of the same suit. For my Uncle Frank, though, there is seldom time to deal out complete poker hands before he is asked to leave whatever establishment he is in. Consequently, Uncle Frank often makes wagers based on what he calls li’l flushes.
The bet
A little flush (oops, sorry; I mean li’l flush) is any two cards of the same suit. Frank has a wager that he almost always wins that has to do with finding two cards of the same suit in your hand. Again, because of time constraints, his poker hands have only four cards, not five.
The wager is that you deal me four cards out of a random deck, and I will get at least two cards of the same suit. While this might not seem too likely, it is actually much less likely that there would be four cards of all different suits. I figure the chance of getting four different suits in a four-card hand is about 11 percent. So, the likelihood of getting a li’l flush is about 89 percent!
Why it works
There are a variety of ways to calculate playing-card hand probabilities. For this bar bet, I use a method that counts the number of possible winning hand combinations and compares it to the total number of hand combinations. This is the method used in “Play with Dice and Get Lucky” [Hack #43].
To think about how often four cards would represent four different suits, with no two-card flushes amongst them, count the number of possible four-card hands. Imagine any first card (52 possibilities), imagine that card combined with any remaining second card (52x51), add a third card (52x51x50) and a fourth card (52x51x50x49), and you’ll get a total of 6,497,400 different four-card hands.
Next, imagine the first two cards of a four-card hand. These will match only .2352 of the time (12 cards of the same suit remain out of a 51-card deck). So, about one-and-a-half million four-card deals will find a flush in the first two cards. They won’t match another .7648 of the time. This leaves 4,968,601 hands with two differently suited first two cards.
Of that number of hands, how many will not receive a third card that does not suit up with either of the first two cards? There are 50 cards remaining, and 26 of those have suits that have not appeared yet. So, 26/50 (52 percent) of the time, the third card would not match either suit.
That leaves 2,583,673 hands that have three first cards that are all unsuited. Now, of that number, how many will now draw a fourth card that is the fourth unrepresented suit? There are 13 out of 49 cards remaining that represent that final fourth suit. 26.53 percent of the remaining hands will have that suit as the fourth card, which computes to 685,464 four-card combinations with four different suits. 685,464 divided by the total number of possible hands is .1055 (685,464/6497400).
There’s your 11 percent chance of having four different suits in a four-card hand. Whew! By the way, some super-genius-type could get the same proportion by using just the relevant proportions, which we used along the way during our different counting steps, and not have to count at all:
Finding a Match with Two Decks of Cards
You have a deck of cards. I have a deck of cards. They are both shuffled (or, perhaps, souffl\x8e d, as my spell check suggested I meant to say). If we dealt them out one at a time and went through both decks one time, would they ever match? I mean, would they ever match exactly, with the exact same card—for example, us both turning up the Jack of Clubs at the same time?
The bet
Most people would say no, or at least that it would certainly happen occasionally, but not too frequently. Astoundingly, not only will you often find at least one match when you pass through a pair of decks, but it would be out of the ordinary not to. If you make this wager or conduct this experiment many times, you will get at least one match on most occasions. In fact, you will not find a match only 36.4 percent of the time!
Why it works
Here’s how to think about this problem statistically. Because the decks are shuffled, one can assume that any two cards that are flipped up represent a random sample from a theoretical population of cards (the deck). The probability of a match for any given sample pair of cards can be calculated. Because you are sampling 52 times, the chance of getting a match somewhere in those attempts increases as you sample more and more pairs of cards. It is just like getting a 7 on a pair of dice: on any given roll, it is unlikely, but across many rolls, it becomes more likely.
To calculate the probability of hitting the outcome one wishes across a series of outcomes, the math is actually easier if one calculates the chances of not getting the outcome and multiplying across attempts. For any given card, there is a 1 out of 52 chance that the card in the other deck is an exact match. The chances of that not happening are 51 out of 52, or .9808.
You are trying to make a match more than once, though; you are trying 52 times. The probability of not getting a match across 52 attempts, then, is .9808 multiplied by itself 52 times. For you math types, that’s .980852.
Wait a second and I’ll calculate that in my head (.9808 times .9808 times .9808 and so on for 52 times is...about...0.3643). OK, so the chance that it won’t happen is .3643. To get the chance that it will happen, we subtract that number from 1 and get .6357.
You’ll find at least one match between two decks about two-thirds of the time! Remarkable. Go forth and win that free lemonade.
Play with Dice and Get Lucky
Here are some honest wagers using honest dice. Just because you aren’t cheating, though, doesn’t mean you won’t win.
It is an unfortunate stereotype that statisticians are glasses-wearing introspective nerds who never have a beer with the gang. This is such an absurd belief, that just thinking about it last Saturday and Sunday at my weekly Dungeons & Dragons gathering, I laughed so hard that my monocle almost landed in my sherry.
The truth is that displaying knowledge of simple probabilities in a bar can be quite entertaining for the patrons and make you the life of the party. At least, that’s what happens according to my Uncle Frank, who for years has used his stats skills to win free drinks and pickled eggs (or whatever those things are in that big jar that are always displayed in the bars I see on TV).
Here are a few ways to win a bet using any fair pair of dice.
Distribution of Dice Outcomes
First, let’s get acquainted with the possibilities of two dice rolled once. You’ll recall that most dice have six sides (my fantasy role-playing friends and I call these six-sided dice) and that the values range from 1 to 6 on each cube.
Calculating the possible outcomes is a matter of listing and counting them. Figure 4-2 shows all possible outcomes for rolling two dice.
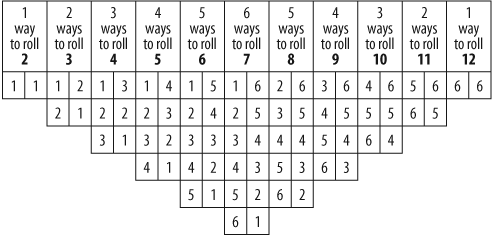
This distribution results in the frequencies shown in Table 4-15.
| Total roll | Chances | Frequency |
| 2 | 1 | 2.8 percent |
| 3 | 2 | 5.6 percent |
| 4 | 3 | 8.3 percent |
| 5 | 4 | 11.1 percent |
| 6 | 5 | 13.9 percent |
| 7 | 6 | 16.7 percent |
| 8 | 5 | 13.9 percent |
| 9 | 4 | 11.1 percent |
| 10 | 3 | 8.3 percent |
| 11 | 2 | 5.6 percent |
| 12 | 1 | 2.8 percent |
| Total number of possible outcomes | 36 | 100 percent |
The game of craps, of course, is based entirely on these expected frequencies. Some interesting wagers might come to mind as you look at this frequency distribution. For example, while a 7 is the most common roll and many people know this, it is only slightly more likely to come up than a 6 or 8.
In fact, if you didn’t have to be specific, you could wager that a 6 or an 8 will come up before a 7 does. Of all totals that could be showing when those dice are done rolling, more than one-fourth of the time (about 28 percent) the dice will total 6 or 8. This is substantially more likely than a 7, which comes up only one-sixth of the time.
Bar Bets with Dice
My Uncle Frank used to bet any dull-witted patron that he would roll a 5 or a 9 before the patron rolled a 7. Uncle Frank won 8 out of 14 times.
Sometimes, old Frankie would wager that on any one roll of a pair of dice, there would be a 6 or a 1 showing. Though, at first thought, there would seem to be at least a less than 50 percent chance of this happening, the truth is that a 1 or 6 will be showing about 56 percent of the time. This is the same probability for any two different numbers, by the way, so you could use an attractive stranger’s birthday to pick the digits and maybe start a conversation, which could lead to marriage, children, or both.
If you are more honest than my Uncle Frank (and there is a 98 percent chance that you are), here are some even-money bets with dice. The outcomes in column A are equally as likely to occur as the outcomes in column B:
The odds are even for either outcome.
Why It Works
For the bets presented in this hack, here are the calculations demonstrating the probability of winning:
| Wager | Number of winning outcomes | Calculation | Resultingproportion |
| 5 or 9 versus 7 | 8 versus 6 | 8/14 | .571 |
| 1 or 6 showing | 20 | 20/36 | .556 |
| 2 or 12 versus 3 | 2 versus 2 | 2/4 | .500 |
| 2, 3 or 4 versus 7 | 6 versus 6 | 6/12 | .500 |
| 5, 6 or 7 versus 8 or higher | 15 versus 15 | 15/30 | .500 |
The “Wager” column presents the two competing outcomes (e.g., will a 5 or 9 come up before a 7?). The “Number of winning outcomes” column indicates number of different dice rolls that would result in either side of the wager (e.g., 8 chances of getting a 5 or 9 versus only 6 chances of getting a 7). The “Resulting proportion” column indicates your chances of winning.
You can win two different ways with these sorts of bets. If it is an even-money bet, you can wager less than your opponent and still make a profit in the long run. He won’t know the odds are even. If chance favors you, though, consider offering your target a slightly better payoff, or pick the outcome that is likely to come up more often.
Sharpen Your Card-Sharping
In Texas Hold ‘Em and other poker games, there are a few basic preliminary skills and a bit of basic knowledge about probability that will immediately push you from absolute beginner to the more comfortable level of knowing just enough to get into trouble as a card sharp.
The professional Texas Hold ‘Em poker players who appear on television are different from you and me in just a couple of important ways. (Well, they likely differ from you in just a couple of important ways; they differ from me in so many important ways that even my computer brain can’t count that high.) Here are two areas of poker playing that they have mastered:
Knowing the rough probability of hitting the cards they want at different stages in a hand (in the flop, on the river, and so on)
Quickly identifying the possible better hands that could be held by other players
This hack presents some tips and tools for moving from novice to semi-pro. These are some simple hunks of knowledge and quick rules of thumb for making decisions. Like the other poker hacks in this book, they provide strategy tips based purely on statistical probabilities, which assume a random distribution of cards in a standard 52-card deck.
Improving Your Hand
Half the time, you will get a pair or better in Texas Hold ‘Em. I’ll repeat that because it is so important in understanding the game. Half the time (a little under 52 percent actually), if you stay in long enough to see seven cards (your two cards plus all five community cards), you will have at least one pair. It might have been in your hand (a pocket or wired pair), it might be made up of one card in your hand and one from the community cards, or your pair might be entirely in the community cards for everyone to claim.
If for the majority of the time the average player will have a pair when dealt seven cards, then sticking around until the end with a low pair means you are—only statistically speaking, of course—likely to lose. In other words, there is a greater than 50 percent chance that the other player has at least a pair, and that pair will probably be 8s or higher (only six out of thirteen pairs are 7s or lower.)
Knowing how common pairs are explains why Aces are so highly valued. Much of the time, heads-up battles come down to a battle of pair versus pair. Another good proportion of the time, the Ace plays an important role as a kicker or tiebreaker. Aces are good to have, and it’s all because of the odds.
Probabilities
Decisions about staying in or raising your bet in an attempt to lower the number of opponents you have to beat can be made more wisely if you know some of the common probabilities for some of the commonly hoped-for outcomes. Table 4-16 presents the probability of drawing a card that helps you at various stages in a hand. The probabilities are calculated based on how many cards are left in the deck, how many different cards will help you (your outs), and how many more cards will be drawn from the deck. For example, if you have an Ace-King and hope to pair up, there are six cards that can make that happen; in other words, you have six outs. If you have only an Ace high but hope to find another Ace, you have three outs. If you have a pocket pair and hope to find a powerful third in the community cards, you have just two outs.
| Cards leftto be dealt | Six outs | Three outs | Two outs |
| 5 (before the flop) | 49 percent | 28 percent | 19 percent |
| 2 (after the flop) | 24 percent | 12 percent | 8 percent |
| 1 (after the turn) | 13 percent | 7 percent | 4 percent |
The situations described here assume you have already been dealt two cards. After all, in most poker games, the bet before the flop is predetermined, so there are no decisions to be made. By the way, because you should probably back out of hands that did not amount to anything in the flop, you’ll want to know your chances of improving in the flop itself. They are:
Implications
Here are a few quick observations and implications to etch in your mind, based on the distribution described in Table 4-16.
Half the time, you will pair up. This is true for high cards, such as Big Slick (Ace-King) or low cards, such as 2-7. You can even pick from the two cards you have and pair that one up 28 percent of the time. Implication: when low on chips in tournament play, go all-in as soon as you get that Ace.
If you don’t hit the third card, you need to turn a pair into a set (three of a kind) on the flop, and there is only an 8 percent chance you will hit it down the road. Implication: don’t spend too much money waiting around for your low pair to turn into a gangbuster hand.
Your Ace-King or Ace-Queen that looked pretty good before the flop diminishes in potential as more cards are revealed without pairing up or getting straight draws. 87 out of 100 times, that great starting hand remains a measly high-card-only hand if you haven’t hit before the river. Implication: stay in with the unfulfilled dream that is Ace-King only if you can do so cheaply.
Reading the Community Cards in a Flash
Here are some common-sense statements about your opponents’ hands that must be true but aren’t always said out loud:
| If the community cards do not have... | Your opponent(s) cannot have... |
| A pair | Four of a kind |
| A pair | A full house |
| Three cards of the same suit | A flush |
| Three cards within a five-card range | A straight |
You can make quicker decisions about what your opponents might have by learning these rules. Then, you can automatically rule out killer hands when the situation is such that they are impossible. You may not be worried about speed, but you can spend your time concentrating on more important decisions if you don’t have to waste mental energy figuring these things out from scratch each time.
Amaze Your 23 Closest Friends
What are the chances of at least two people in a group sharing a birthday? Depending on the number of people present, surprisingly high. Impress your friends at parties (and perhaps win some money in a bar bet) using these simple rules of probability.
Some events that seem logically unlikely can actually turn out to be quite probable in some cases. One such example is determining the probability that at least two people in a group share a birthday. Many people are shocked to learn that as long as there are at least 23 people in the group, there is a better than 50 percent chance that at least 2 of them will have the same birthday! By using a few simple rules of probability, you can figure out the likelihood of this event occurring for groups of any size, and then amaze your friends when your predictions come true.
Tip
You could also use this result to make some cash in a bar bet (as long as there are at least 23 people there).
So, how do you figure out the probability of at least two people sharing a birthday? To solve this problem, you need to make a couple of assumptions about how birthdays are distributed in the population and know a few rules about how probabilities work.
Getting Started
To determine the chances of at least two people sharing a birthday, we have to make a couple of reasonable assumptions about how birthdays are distributed. First, let’s assume that birthdays are uniformly distributed in the population. This means that approximately the same number of people are born on every single day of the year.
This is not necessarily perfectly true, but it’s close enough for us to still trust our results. However, there is one birthday for which this is definitely not true: February 29, which occurs only every four years on Leap Year. The good news is that few enough people are born on February 29 that it is easy for us to just ignore it and still get accurate estimates.
Once we’ve made these two assumptions, we can solve the birthday problem with relative ease.
Applying the Law of Total Probability
In our problem, there are only two mutually exclusive possible outcomes:
At least two people share a birthday.
No one shares a birthday.
Since one of these two things must occur, the sum of the two probabilities will always be equal to one. Statisticians call this the Law of Total Probability, and it comes in handy for this problem.
Tip
The term mutually exclusive means that if one event occurs, the other one cannot occur, and vice versa.
A simple coin-flipping example can help picture how this works. With a fair coin, the probability of getting a heads is 0.5, just as the probability of getting a tails is 0.5 (which is another example of mutually exclusive events, because the coin can’t come up heads and tails in the same flip!). Once you flip the coin, one of two things has to happen. It must land either heads up or tails up, so the probability of heads or tails occurring is 1 (0.5 + 0.5). Conversely, we can think of the probability of heads as one minus the probability of tails (1 - 0.5 = 0.5), and vice versa.
Sometimes, it’s easier to determine the probability of an event not occurring and then use that information to determine the probability that it will occur. The probability of no one sharing a birthday is a bit easier to figure out, and it depends only on how many people are in the group.
Imagine that our group contains only two people. What’s the probability that they share a birthday? Well, the probability that they don’t share a birthday is easy to figure: person #1 has some birthday, and there are 364 other birthdays person #2 might have that would result in them not sharing a birthday. So, mathematically, it’s 364 divided by 365 (the total number of possible birthdays), or 0.997.
Since the probability of the two people not sharing a birthday is 0.997 (a very high probability), the probability of them actually sharing a birthday is equal to 1 - 0.997 (0.003, a very low probability). This means that only 3 out of every 1,000 randomly selected pairs of people will share a birthday. So far, this makes perfect logical sense. However, things change (and change quickly) once we start adding more people to our group!
Calculating the Probability of Independent Events
The other trick we need to solve our problem is applying the idea of independent events. Two (or more) events are said to be independent if the probability of their co-occurrence is equal to the product of their individual probabilities.
Once again, this is simple to understand with a nice, easy coin-flipping example. If you flip a coin twice, the probability of getting heads twice is equal to the probability of heads multiplied by the probability of heads (0.5x0.5 = 0.25), because the outcome of one coin flip has no influence on the outcome of the other (hence, they are independent events).
So, when you flip a coin twice, one out of every four times the results will be two heads in a row. If you wanted to know the probability of flipping three heads in a row, the answer is 0.125 (0.5x0.5x0.5), which means that three heads in a row happens only one time out of every eight.
In our birthday problem, every time we add another person to the group, we’ve added another independent event (since one person’s birthday doesn’t influence anyone else’s birthday), and thus we’ll be able to figure out the probability of at least two of those people sharing a birthday, regardless of how many people we add; we’ll just keep on multiplying probabilities together.
To review, no matter how many people are in our group, only one of two mutually exclusive events can occur: at least two people share a birthday or no one shares a birthday. Because of the Law of Total Probability, we know that we can determine the probability of no one sharing a birthday, and one minus that value will be equal to the probability that at least two share a birthday. Lastly, we also know that each person’s birthday is independent of the other group members. Got all that? Good, let’s proceed!
Solving the Birthday Problem
We’ve already determined that the probability of two people not sharing a birthday in a group of two is equal to 0.997. Let’s say we add another person to the group. What is the probability of no one sharing a birthday? There are 363 other birthdays person #3 could have that would result in none of them sharing a birthday. The probability of person #3 not sharing a birthday with the other two is therefore 363/365, or 0.995 (slightly lower).
But remember, we’re interested in the probability that no one shares a birthday, so we use the rule of independent events and multiply the probability that the first two won’t share a birthday by the probability that the third person won’t share a birthday with the other two: 0.997x0.995 = 0.992. So, in a group of three people, the probability that none of them share a birthday is 0.992, which means that the probability that at least two of them share a birthday is 0.008 (1 - 0.992).
This means that only 8 out of every 1,000 randomly selected groups of 3 people will result in at least 2 of them sharing a birthday. This is still a pretty small chance, but note that the probability has more than doubled by moving from two people to three (0.003 compared to 0.008)!
Once we start adding more and more people to our group, the probability of at least two people sharing a birthday starts to increase very quickly. By the time our group of people is up to 10, the probability of at least 2 sharing a birthday is up to 0.117. How do we determine this in general? For every person added to the group, another fraction is multiplied by the previous product. Each additional fraction will have 365 as the denominator, and the numerator will be 365 minus the number of additional people beyond the first.
So, for our previously mentioned group of 10 people, the numerator for the last fraction is 356 (365 - 9), determined like so:
This tells us that the probability of no one sharing a birthday in a group of 10 people is equal to 0.883 (much lower than what we saw for 2 or 3 people), so the probability that at least 2 of them will share a birthday is 0.117 (1 - 0.883).
The first fraction is the probability that the second person won’t share a birthday with the first person. The second fraction is the probability that the third person won’t share a birthday with the first two. The third fraction is the probability that the fourth person won’t share a birthday with the first three, and so on. The ninth and final fraction is the probability that the tenth person won’t share a birthday with any of the other nine.
Tip
In order for no one to share a birthday, every single one of the events in the chain has to co-occur, so we determine the probability of all of them happening in the same group of people by multiplying all of the individual probabilities together. Every time we add another person, we include another fraction into the equation, which makes the final product get smaller and smaller.
Solving for Almost Any Group Size
As the group size increases, it becomes increasingly more likely that at least two people will share a birthday. This makes perfect sense, but what surprises most people is how quickly the probability increases as the group gets bigger. Figure 4-3 illustrates the rate at which the probability goes up when you add more and more people.
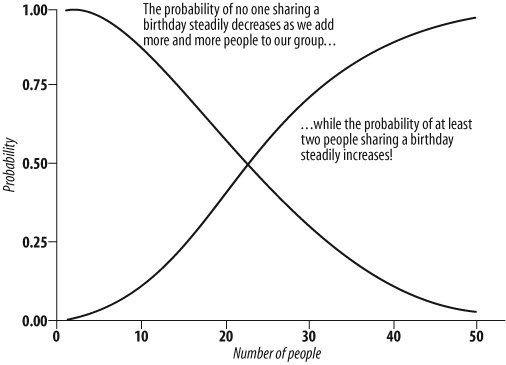
For 20 people, the probability is 0.411; for 30 people, it’s 0.706 (meaning that 7 times out of 10 you will win money on your bet, which are pretty good odds). If you have 23 people in your group, the chances are just slightly better than 50/50 that at least 2 people will share a birthday (the probability is equal to 0.507).
When all is said and done, this is a pretty neat trick that never ceases to surprise people. But remember to make the bar bet only if you have at least 23 people in the room (and you’re willing to accept 50/50 odds). It works even better with more people, because your chances of winning go up dramatically every time another person is added. To have a better than 90 percent chance of winning your bet, you’ll need 41 people in the room (probability of at least 2 people sharing a birthday = 0.903). With 50 people, there’s a 97 percent chance you’ll win your money. Once you have 60 people or more, you are practically guaranteed to have at least 2 people in the room who share a birthday and, of course, if you have 366 people present, there is a 100 percent chance of at least 2 people sharing a birthday. Those are great odds if you can get someone to take the bet!
William Skorupski
Design Your Own Bar Bet
With a few calculations, and perhaps some spreadsheet software, you can figure the probabilities associated with all sorts of “spontaneous” friendly wagers.
Several of the statistics hacks elsewhere in this chapter use decks of cards [Hack #42] or dice [Hack #43] as props to demonstrate how some seemingly rare and unusual outcomes are fairly common. As someone who’s interested in educating the world on statistical principles, you no doubt will wish to use these teaching examples to impress and instruct others. Hey, if you happen to win a little money along the way, that’s just one of the benefits of a teacher’s life.
But there’s no need to rely on the specific examples provided here, or even to carry cards and dice around (though, knowing you the way I think I do, you might have plenty of other reasons to carry cards and dice around). Here are a couple of basic principles you can use to make up your own bar bet with any known distribution of data, such as the alphabet, numbers from 1 to 100, and so on:
The rest of this hack will show you how to use these principles to your advantage in your own custom-made bar bets.
Principle 1
The probability of any given event occurring is equal to the number of outcomes, which equal the event divided by the number of possible outcomes. For example, what are the chances that you and I were born in the same month? Pretending for a second that births are distributed equally across all months, the probability is 1/12. There is only one outcome that counts as a match (your birth month), and there are 12 possible outcomes (the 12 months of the year).
What about the probability that any one of two people reading this book has the same birth month as me? Intuitively, that should be a bit more likely than 1 out of 12. The formula to figure this out is not quite as simple as one would like, unfortunately. It is not 1/12 times itself, for example. That would produce a smaller probability than we began with (i.e., 1/24). Nor is the formula 1/12 + 1/12. Though 2/12 seems to have promise as the right answer—because it is bigger than 1/12, indicating a greater likelihood than before—these sorts of probabilities are not additive. To prove to yourself that simply adding the two fractions together won’t work, imagine that you had 12 people in the problem. The chance of finding a match with my birth month among the 12 is obviously not 12/12, because that would guarantee a match.
The actual formula for computing the chances of an event occurring across multiple opportunities is based on the notion of taking the proportional chance that an event will not happen and multiplying that proportion by itself for each additional “roll of the dice.” At the conclusion of that process, subtracting the result from 1.0 should give the chance that the event will happen.
This formula has a theoretical appeal because it is logically equivalent to the more intuitive methods (it uses the same information). It is appealing mathematically, too, because the final estimate is bigger than the value associated with a single occurrence, which is what our intuition believes ought to be the case. Think about it this way: how many times will it not happen, and among those times, how many times will it not happen on the next occurrence?
Here’s the equation to compute the probability that someone among two readers will have the same birth month as I do:
Principle 2
To get someone to accept a wager or to amaze an audience with the occurrence of any given outcome, the likelihood must sound small. So, wagers or magic tricks having to do with the 365 days in a year, or the 52 cards in a deck, or all the possible phone numbers in a phone book are more effective and astounding because those numbers seem big in comparison to the number of winning outcomes (e.g., one).
The chance of any unlikely event occurring on any single event is indeed small, so the intuitive belief expressed in this principle is correct. As we have seen, though, the chances of the event occurring increases if you get more than one shot at it, and it can increase rapidly.
Rolling Your Own Bar Bet
Let’s walk through the steps that verify my advantage for a couple of wagers I just made up.
Letters of the alphabet
For this wager, I’ll pick five letters of the alphabet. I bet that if I choose six people and ask them to randomly pick any single letter, one or more of them will match one of my five letters. Here’s how the bet plays out:
- Number of possible choices
There are 26 letters in the alphabet.
- Probability of a single attempt failing
There are 21 out of 26 possibilities that are not matches: 21/26 = .808.
- Number of attempts
6
- Probability of all 6 attempts failing
.8086 = .278
- Probability of something other than the previous options occurring
1 - .278 = .722
The chance of my winning this bet is 72 percent.
Pick a number, any number
This time, I’ll pick 10 numbers from 1 to 100. I bet that if I choose 10 people and ask them to randomly pick any single number from 1 to 100, one or more of them will match one of my ten numbers. Here’s how this one works out:
- Number of possible choices
There are 100 numbers to choose from.
- Probability of a single attempt failing
There are 90 out of 100 possibilities that are not matches: 90/100 = .90.
- Number of attempts
10
- Probability of all 10 attempts failing
9010 = .349
- Probability of something other than the previous options occurring
1 - .349 = .651
The chance of my winning this bet is 65 percent.
On your own
Copy the steps and calculations just shown to develop your own original party tricks. None of these demonstrations require any props, just a willing and honest volunteer.
Notice that the calculations are based on people randomly picking numbers. In reality, of course, people will not pick a letter or number that they have just heard someone else pick. In other words, their choices will not be independent of other choices. If the choices are made based on the knowledge that previous answers are not correct, this helps your odds a little bit. For example, on the 10-out-of-100 numbers wager, if there is no chance that the 10 people will choose a number that has already been chosen, your chances of getting a match go from 65 percent to 67 percent.
Make Sure the Sucker Isn’t You!
It is fun to play with others, but you never know when you will get caught in someone else’s clever statistics trap. For instance, remember that 1-out-of-12 chance that you have the same birth month as me? I fooled you! I was born in February. There are fewer days in that month than the others, so your chances of being born in that month are actually less than 1 out of 12. There are 28.25 days in February (an occasional February 29 accounts for the .25) and 365.25 days in the year (the occasional Leap Year accounted for again). The chance that you were born in the same month as me is 28.25/365.25, or 7.73 percent, not the 8.33 percent that is 1 out of 12.
So, you are less likely to have the same birth month as me. Come to think of it, the records of my birth, my birth certificate, and so on were lost in a fire many years ago. So, the original data about my birth is now missing.
For all I know, I might not even be born yet!
Go Crazy with Wild Cards
Wild cards are added to a poker game to ratchet up the fun. Statistically, though, they make things all discombobulated.
Hundreds of years ago, poker players settled on a rank order of hands and decided what would beat what. Pleasantly, for the field of statistics, the order they settled on is a perfect match with the probability that a player will be dealt each hand. Presumably, the developers of poker rules either did the calculations or referenced their own experience as to how frequently they saw each kind of hand in actual play. It is also possible that they took a deck of cards, paper and pencil, and a free afternoon, dealt themselves many thousands of random poker hands, and collected the data. Whatever the method, the rank order of poker hands is a perfect match with the relative scarcity of being dealt those particular combinations of cards.
Rank ordering, though, does not take into account the meaningful distance between one type of hand and the type of hand ranked immediately below it. A straight flush, for example, is 16 times less likely to occur than the hand ranked immediately below it, which is four of a kind, while a flush is only half as likely as a straight, the hand ranked immediately below a flush.
Before we talk about the problem with playing with wild cards (cards, often jokers, that can take on any value the holder wishes), let’s review the ranking of poker hands. Table 4-17 shows the probability that a given hand will occur in any random five cards, as well as each hand’s relative rarity when compared to the hand ranked just below it in the table.
| Hand | Probability | Relative rarity |
| Straight flush | .000015 | 16 times less likely |
| Four of a kind | .00024 | 5.8 times less likely |
| Full house | .0014 | 1.4 times less likely |
| Flush | .0019 | 2.1 times less likely |
| Straight | .0039 | 4.4 times less likely |
| Three of a kind | .021 | 2.3 times less likely |
| Two pair | .048 | 8.8 times less likely |
| One pair | .42 | 1.2 times less likely |
| Nothing | .50 | ----- |
To gamblers, there are several observations of note from Table 4-17. First, with five cards, half the time players have nothing. Almost half the time, a player has a pair. A player will have something better than a pair only 8 percent of the time.
Second, some hands treated as if they are wildly different in rarity are almost equally likely to occur. Notice that a flush and a full house occur with about the same frequency.
Finally, after three of a kind, the likelihood of a better hand occurring drops quickly. In fact, there are two giant drops in probability: having either nothing or a pair occurs most of the time (92 percent), then two pair or three of a kind occurs another 7 percent of the time, and something better than three of a kind is seen less than 1 percent of the time.
The Problem with Wild Cards
This is all very interesting, but what does it have to do with the use of wild cards? Well, adding wild cards to the deck screws up all of these time-tested probabilities. Assuming that the holder of a wild card wishes to make the best hand possible, and also assuming that one wild card, a joker, has been added to the deck, Table 4-18 shows the new probabilities, compared to the traditional ones.
| Hand | Probability with wild card | Classic probability | Change in probability with wild card |
| Five of a kind | .0000045 | ----- | ----- |
| Straight flush | .000064 | .000015 | +327 percent |
| Four of a kind | .0011 | .00024 | +358 percent |
| Full house | .0023 | .0014 | +64 percent |
| Flush | .0027 | .0019 | +42 percent |
| Straight | .0072 | .0039 | +85 percent |
| Three of a kind | .048 | .021 | +129 percent |
| Two pair | .043 | .048 | -10 percent |
| One pair | .44 | .42 | +5 percent |
| Nothing | .45 | .50 | -10 percent |
The problem with wild cards is apparent as we look at the new probabilities, especially when we look at three of a kind and two pair. Three of a kind is now more common than two pair!
The rank order that traditionally determines which hand beats what is no longer consistent with actual probabilities. Additionally, the chances of getting two pair actually drop when a wild card is added. Other probabilities change, of course, with all the other playable hands becoming more likely. Some super hands, while remaining rare, increase their frequency quite dramatically: hands better than three of a kind are about twice as common as they were before.
Knowing these new probabilities gives smart poker players an edge. In fact, contrary to the stereotype that experienced and professional poker players avoid games with wild cards because they are childish or for amateurs, some informed players seek out these games because they believe they have the advantage over your more naïve types. (You know, those naïve types, like people who don’t read Hacks books?)
Why It Works
As you can see in Table 4-18, using wild cards lessens the chance of getting two pair. But why would this be? Surely adding a wild card means that sometimes I can turn a one-pair hand into a two-pair hand. This is true, but why would I? Imagine a player has one pair in her hand, and she gets a wild card as her fifth card. Yes, she could match that wild card up with a singleton and call it a pair, declaring a hand with two pairs. On the other hand, it would be smarter for her to match it up with the pair she already has and declare three of a kind. Given the option between two pair and three of a kind, everyone would choose the stronger hand.
The Other Problem with Wild Cards
The existence of wild cards creates a paradox that drives game theorists crazy. The paradox works like this:
The ranking of hands and their relative value in a poker game should be based on the frequency of their occurrence. The less frequently occurring hand should be valued more than more commonly occurring hands.
In the case of choosing whether to use a wild card to turn a hand into two pair or three of a kind, players will usually choose to create three of a kind. This changes the frequency in practice such that two pair becomes less common than three of a kind.
Because rankings should be based on probabilities, the rules of poker should be changed when wild cards are in play to make two pair more valuable than three of a kind.
With revised rankings, three of a kind would be worth less than two pair, so now smart players would use their wild card to make two pair instead of three of kind, so two pair would quickly become more common than three of a kind.
The ranking rules would then have to be changed again to match the actual frequencies resulting from the previous rule change, and a never-ending cycle would begin.
Table 4-18 avoids this paradox by assuming that players want to make their best hand based on traditional rankings. Clever of me, huh? Want to play cards?
Never Trust an Honest Coin
Of all that is sacred in the often secular world of statistics, no concept has more faith than the honest spin of an honest coin. Fifty percent chance of either heads or tails, right? The troubling answer is, apparently...no!
A basic explanation of chance and how it operates almost always includes a simple example of flipping or spinning a coin. “Heads you win; tails I win” is the customary method for settling a variety of disputes, and the binomial distribution [Hack #66] is usually described and taught as the pattern of random coin outcomes.
But as it turns out, if you spin a coin, especially a brand-new coin, it might land tails up more often than heads up.
Shiny New Pennies
You know the look and feel of a brand-new, mint-condition penny? It’s so bright that it looks fake. It’s so detailed and sharp around the edges that you have to be careful not to cut yourself.
Well, get yourself one of them bright, sharp little fellas and spin it 100 times or so. Collect data on the heads-or-tails results, and prepare to be amazed because tails is likely to come up more than 50 times. If our understanding of the fairness of coins is correct, a coin should come up tails more than half the time less than half the time. (Say that last sentence out loud and it makes more sense.) Not with the spin of a new penny, though.
New coins, at least new pennies, tend to have a crisp edge that actually is a bit longer or taller on the tail’s side (the tail side is imprinted a little deeper into the penny than the head side). Figure 4-4 gives a sense of how this edge looks. If you spin an object shaped like this, there is a tendency for the side with the extra long edge to land face-up.
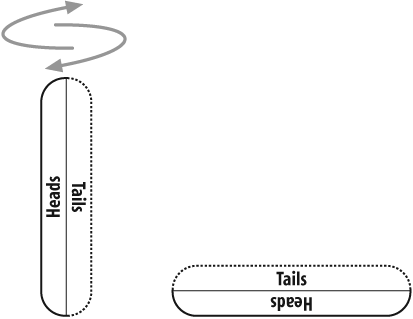
Imagine spinning the cap from a bottle of beer or soda pop. Not only would it not spin so well, but you also wouldn’t be surprised to see it land with the edge side up. A new penny is shaped kind of like a bottle cap, just not quite so asymmetrical. The little extra edge, though, is enough over many spins to give tails the advantage.
Binomial Expectations
The possible existence of a bottle-cap effect presents a testable hypothesis:
The probability of a freshly minted spinning penny landing with tails up is greater than 50 percent.
Of course, just by chance, over a few flips we might find a coin landing tails up more often than heads, but that wouldn’t really prove anything. We know that chance will bring results in small samples that don’t represent the nature of the population from which the samples were drawn.
Our sample of coin spins should represent a population of infinite coin spins. If we spin a coin 100 times and find 51 tails, is that acceptable evidence for our hypothesis? Probably not; chance could be the explanation for a proportion other than .50. How about 52 tails? How about 52 percent tails and a million spins?
Statistics comes to the rescue once again and provides a standard by which to judge the outcome of our experiment. We know from the binomial distribution that 100 spins of a theoretically fair coin (one without the unbalanced edge weirdness) will produce 51 or more tails 42 percent of the time. Old-school statistical procedures require that an outcome must have a 5 percent or lower chance of occurring to be treated as statistically significant—not likely to have occurred by chance. So, we probably wouldn’t accept 51 percent after 100 spins as acceptable support for the hypothesis.
On the other hand, if we spun that hard-working coin 6,774 times and got 51 percent tails, that would happen by chance only 5 percent of the time. Our level of significance for that result is .05. Table 4-19 shows the likelihood of getting a certain proportion of tails just by chance, when the expected outcome is 50 percent tails. Deviations from this expected proportion that are statistically significant can be treated as evidence of support for our hypothesis.
| Number of spins | Proportion of tails | Probability of the given proportion or higher |
| 100 | .51 | .42 |
| 100 | .55 | .16 |
| 100 | .58 | .05 |
| 500 | .51 | .33 |
| 500 | .55 | .01 |
| 500 | .58 | .0002 |
| 1,000 | .51 | .26 |
| 1,000 | .55 | .001 |
| 1,000 | .58 | .0000002 |
Notice that the power of this analysis really increases as the sample size gets big [Hack #8]. You need only a slight fluctuation from the expected to support your hypothesis if you spin that coin 500 or 1,000 times. With 100 spins, you need to see a proportion of tails at or above .58 to believe that there really is an advantage for tails with a newly minted penny.
The distance of the observed proportion from the expected proportion is expressed as a z score [Hack #26]. Here’s the equation that produces z scores and generated the data in Table 4-19:
The probability assigned is the area under the normal curve, which remains above that z score.
Where It Doesn’t Work
Once you prove to yourself that this tail advantage is real, heed this reminder before you go running off to win all sorts of crazy wagers. You must spin the coin! Don’t flip it. Say it with me: spin, don’t flip.
See Also
The term bottle-cap effect was suggested on an entertaining web page that includes a nice discussion of the extra-tall edge on penny tails. It is maintained by Dr. Gary Ramseyer at http://www.ilstu.edu/~gcramsey/.
Know Your Limit
Humans don’t always make rational decisions. Even smart gamblers will sometimes refuse a wager when the expected payoff could be huge and the odds are fair. The St. Petersburg Paradox gives an example of a perfectly fair gambling game that perfectly healthy statisticians probably wouldn’t play, just because they happen to be human.
The standard decision-making process for statistically savvy gamblers involves figuring the average payoff for a hypothetical wager and the cost to play, and then determining whether they are likely to break even or, better yet, make a boatload of money. Though one could produce dozens of statistical analyses of gambling all about when a person should and shouldn’t play, the psychology of the human mind sometimes takes over, and people will refuse to take a wager because it just doesn’t feel right.
The Game of St. Petersburg
The game of St. Petersburg is about 300 years old. The parameters of the game were described by Daniel Bernoulli in 1738. Here are the rules:
You pay me a fee to play upfront.
Flip a coin. If it comes up heads, you win and I’ll pay you $2.
If it doesn’t come up heads, we’ll flip again. If heads comes up that time, I’ll pay you 22 ($4).
Supposing heads still hasn’t come up, we flip again. Heads on this third flip, and I pay you 23 ($8).
So far, it sounds pretty good and more than fair for you. But it gets better. We keep flipping until heads comes up. When it eventually arrives, I pay you $2n, where n is the number of flips it took to get heads.
Great game, at least from your perspective. But here’s the killer question: how much would you pay to play?
Tip
The game of St. Petersburg might not really have ever existed as a popular gambling game in the streets of old-time Russia, but it’s been used as a hypothetical example of how the mind processes probability when money is involved. It provided many early statisticians an excuse to analyze the way “expected outcomes” works in our heads. The paper was actually published, by the way, by St. Petersburg Academy, thus the name.
Deciding how much you would pay to play is an interesting process. As a smart statistician, you would certainly pay anything less than $2. Even without all the bigger payoff possibilities, betting you will get heads on a coin flip and getting paid more than the cost of playing is clearly a great bet, and you’d go for it in a shot.
You also probably would gladly pay a full $2. You will win the $2 back half the time, and the other half of the time you will get much more than that! This is a game you are guaranteed to win eventually, so it’s not a question of winning. When you don’t get heads the first time, you have guaranteed yourself at least $4 back, and possibly more—possibly much more.
So, maybe you’d pay $4 to play. Of course, occasionally, your payoff would be really big money—$8, $16, $32, $64...theoretically, the payoff could be close to infinite. But how much would you pay? That’s the 64-dollar question.
Statistical Analysis
Some social science researchers suggest that most people would play this game for something around four bucks, maybe a little more. Few would pay much more. What about statistically, though? What is the most you should pay?
Well, this is where I consider turning in my Stats Fan Club membership card, because I am afraid to tell you the correct answer. The rules of probability as they relate to gambling suggest that people should play this game at any cost. Yes, a statistician would tell you to play this game for any price! As long as the cost is something short of infinity, this is, theoretically, a good wager.
Let’s figure this out. Here’s the payoff for the first six coin flips:
| Flips | Likelihood | Proportion of games | Winnings | Expected payoff |
| 1 | 1 out of 2 | .50 | $2 | $1 |
| 2 | 1 out of 4 | .25 | $4 | $1 |
| 3 | 1 out of 8 | .125 | $8 | $1 |
| 4 | 1 out of 16 | .0625 | $16 | $1 |
| 5 | 1 out of 32 | .03125 | $32 | $1 |
| 6 | 1 out of 64 | .015625 | $64 | $1 |
Tip
Expected payoff is the amount of money you would win on average across all possible outcomes. For a single flip, there are two outcomes: for heads, you win $2; for the other possibility, tails, you get $0. The average payout is $1, the expected payoff for one coin flip (and, it turns out, for any number of coin flips).
If you play this game 64 times, you will get to the sixth coin flip just once, but you will win $64. 32 of those 64 times you will win just $2. The average payoff sounds low—just a buck. Occasionally, though, heads won’t come up for a very long time, and when it finally does, you have won yourself a lot of money. When you start the game, you have no idea how long it will go and it could be very long indeed (a lot like a Peter Jackson film).
Notice a few things about this series of flips and how the chances drop at the same rate as the winnings go up:
Only six coin flips are shown. Theoretically, the flipping could go on forever, though, and no head might ever come up.
With each coin flip, the winnings amount continues to double and the proportion of games where that number of flips would be reached continues to be cut in half.
The “Proportion of games” column never adds to 1.0 or 100 percent, because there is always some chance, no matter how very small, that one more flip will be needed.
The decision rule among us Stats Fan Club members for whether to play a gambling game is whether the expected value of the game is more than the cost of playing. Expected value is calculated by adding up the expected payoff for all possible outcomes.
You’ll recall that the expected payoff for each possible trial is $1. There are an infinite number of possible outcomes, because that coin could just keep flipping forever. To get the expected value, we sum this infinite series of $1 and get a huge total. The expected value for this game is infinite dollars. Since you should play any game where the cost of playing is less than the expected value, you should play this game for any amount of money less than infinity.
Why It Doesn’t Work
Of course, in real life, people won’t pay much more than $2 for such a game, even if they knew all the statistics. No one really knows for sure why smart people turn their noses up at paying very much money for such a prospect, but here are some theories.
Infinite is a lot
Even if you accept in spirit that the game is fair over the long run and would occasionally pay off really big if you played it many, many times, that “long run” is infinitely long, which is an awfully long time. Few people have the patience or deep enough pockets to play a game that relies on so much patience and demands such a large fee.
Decreasing marginal utility
The originator of the problem, Bernoulli, believed that people perceive money as valuable, but the perception is not proportional to the amount of money. In other words, while having $16 is better than having $8, the relative value of one to the other is different than the relative value of having $128 compared to $64.
So, at some point, the infinite doubling of money stops being equally meaningful as a prize. Bernoulli also believed that if you have a lot of money, a small wager is less meaningful than if you have very little money. (Kind of like those wealthy cartoon characters who light their cigars with hundred dollar bills.)
Risk versus reward
Humans tend to be risk averse. That is, they will occasionally risk something in exchange for a reward, but they want that risk to be fairly close to the chances of success. It is true that the game of St. Petersburg has a chance for a massive reward, but the chance might be seen as too little compared to a risk of even $4.
Infinity doesn’t exist
Some philosophers would argue that people do not accept the concept of infinity as a concrete reality. Any sales pitch to encourage people to play this game by promoting the infinity aspects would be less than compelling.
This might be why I don’t buy lottery tickets. I don’t play the lottery because my odds of winning are increased only slightly by actually playing. In my mind, the odds of me winning are infinitely small, or close enough to it that I don’t treat the possibility of winning as real.
See Also
A very interesting and thoughtful discussion of the St. Petersburg Paradox is in the Stanford Encyclopedia of Philosophy. The online entry can be found at http://plato.stanford.edu/entries/paradox-stpetersburg.
Get Statistics Hacks now with the O’Reilly learning platform.
O’Reilly members experience books, live events, courses curated by job role, and more from O’Reilly and nearly 200 top publishers.

