Monitoring Performance with Task Manager
In addition to helping you deal with hung programs, Task Manager lets you see which processes in your system are using computer resources. On the Performance tab, as shown in Figure 42.7, you can see these key resources. The Performance tab in Task Manager provides both graphical and numeric summaries of CPU, memory, disk, and network hardware resource usage. To watch resource usage, leave Task Manager open and always on top as you run programs and use your computer in the usual ways. If you have multiple processors, or a multi-core processor, each may be represented in a separate pane in the CPU history, as shown at the top of the figure.
FIGURE 42.7 Performance tab shows performance data
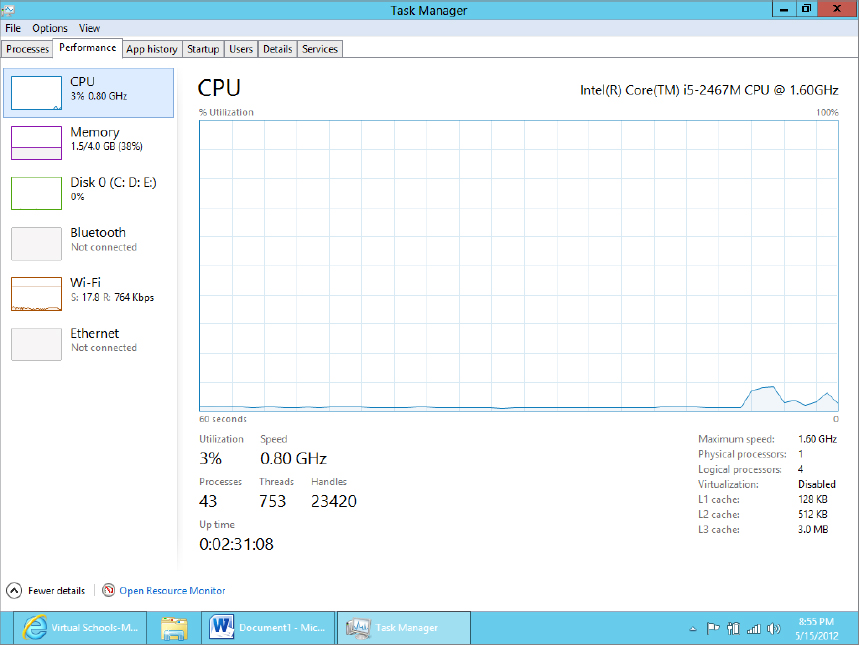
The Performance charts are useful for identifying major performance bottlenecks. For example, if the CPU charts run high, your CPU is working very hard. An errant application can consume inordinate amounts of CPU capacity. Also, reducing the number of running programs ...
Get Windows 8 Bible now with the O’Reilly learning platform.
O’Reilly members experience books, live events, courses curated by job role, and more from O’Reilly and nearly 200 top publishers.

