Accessible Tables
Presenting data in rows and columns is a highly effective device in visual media for adding meaning to data. Consider the simple table example in Figure 13-8.
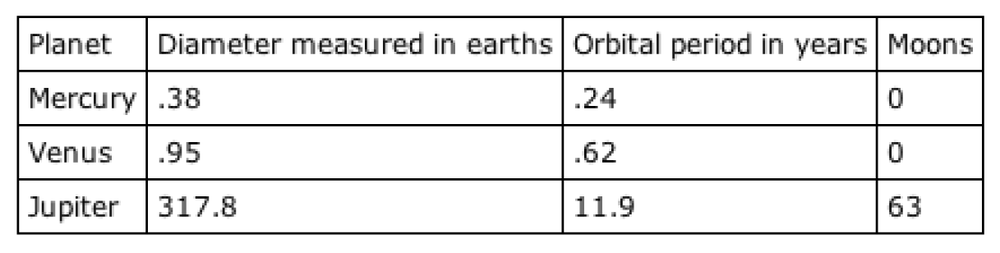
Figure 13-8. A simple table example
Sighted users can easily trace up a column or across a row to a header cell that explains the data’s meaning and context. Blind or severely sight-impaired users do not have this luxury. When using a screen reader or Braille device, the contents of each cell may be read one after another (a process called linearization ). The table in Figure 13-8 might be presented like so: “Planet Diameter measured in earths Orbital period in years Moons Mercury .38 .24 0 Venus .95 .62 0 Jupiter 317.8 11.9 63.” It’s easy to lose track of the meaning of each statistic for a table as simple as this. For complex data tables, such as those pictured in Figure 13-1, it’s nearly impossible.
The (X)HTML specification provides several mechanisms for adding meaning to cell data even when the table is presented non-visually. This section outlines the basics of authoring accessible data tables. For more in-depth tutorials, see these online resources:
“Techniques for Accessible HTML Tables” (from Papers on Section 508), by Steve Ferg (http://www.ferg.org/section508/accessible_tables.html)
“Bring on the Tables,” by Roger Johansson (http://www.456BereaStreet.com/archive/200410/bring_on_the_tables/)
“Creating ...
Get Web Design in a Nutshell, 3rd Edition now with the O’Reilly learning platform.
O’Reilly members experience books, live events, courses curated by job role, and more from O’Reilly and nearly 200 top publishers.

