APPENDIX 8A: COMPARISON OF NEW MODEL WITH GORDON AND GORDON MODEL
The model presented here differs slightly from the Gordon and Gordon model in how the two models treat earnings in excess of the amount invested in positive-NPV projects. In the Gordon and Gordon model, the firm pays these amounts as dividends. In the new model, the firm invests these amounts in projects with NPVs equal to zero. Because of this difference, the models predict slightly different stock prices for a given set of inputs. Table 8A.1 compares the predicted prices from the two models for several sets of inputs. It compares the estimated stock price from Equation 8.8 with the estimated stock price from the Gordon and Gordon model, Equation 8.1. In each case, the required return, k, is equal to 8 percent and the expected earnings next year are $1 per share; therefore, the estimated price is also the estimated P/E.
TABLE 8A.1 Comparison of Estimated Prices: New Model versus the Gordon and Gordon Model when k = 8 Percent
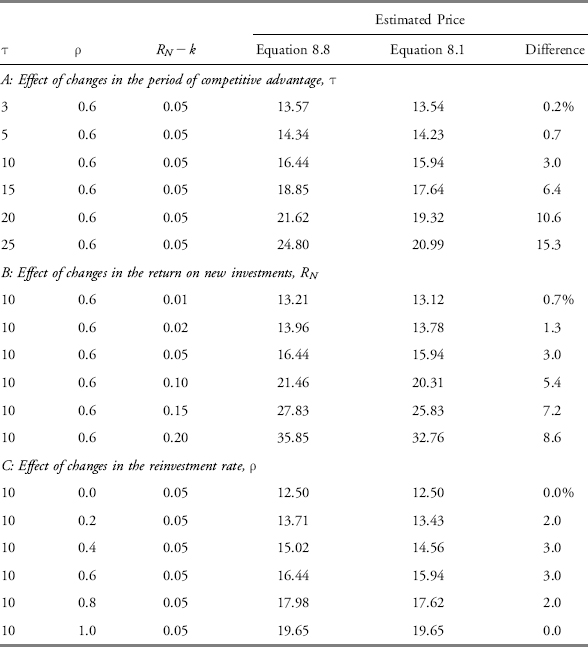
Panel A of Table 8.A1 shows that the two models predict similar prices when the period of competitive advantage, τ, is less than 10. For firms facing competition, this range is probably the most realistic. In addition, the evidence in Gordon and Gordon suggests that analysts do not forecast abnormal performance beyond seven years.
Panel B of Table 8A.1 shows that the two models predict similar ...
Get Valuation Techniques: Discounted Cash Flow, Earnings Quality, Measures of Value Added, and Real Options now with the O’Reilly learning platform.
O’Reilly members experience books, live events, courses curated by job role, and more from O’Reilly and nearly 200 top publishers.

