APPLICATION OF PHI-ELLIPSES
Using PHI-ellipses takes skill and discipline. Applying PHI-ellipses to price movements is simple as soon as a trader has learned to properly use the graphical trading tool. With the Fibotrader software on the Web site, drawing a PHI-ellipse is hardly more difficult than drawing a trend line.
Simulation Results on Historical Data
In order to convince readers that the PHI-ellipse is an interesting trading tool when aiming at absolute return trading results on the products tested, the historical data files are included with the Fibotrader software. Every single trading signal in the historical data files is marked, and each trade shows which PHI-ellipse was used to generate the trade.
Figure 5.40, on the Euro/USD shows a selection of five trading signals out of a total 159 simulation trades used to generate the sample calculation and filed on the companion Web site.
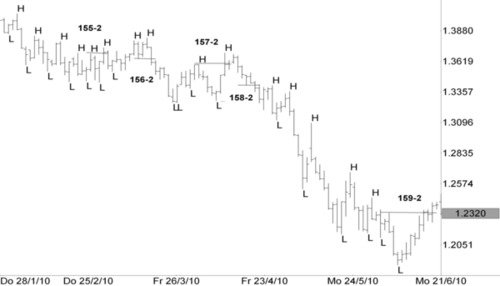
All trading signals on the companion Web site are continuously numbered per asset. The sample trades on the Euro/USD are numbered 155–2, 156–2, 157–2, 158–2, and 159–2.
A horizontal line on the chart indicates where the market entry takes place. The line runs horizontally from a peak or valley, showing that the market entry follows entry rule C of a breakout of a PHI-ellipse in combination with a peak/valley confirmation. ...
Get Trading with Charts for Absolute Return now with the O’Reilly learning platform.
O’Reilly members experience books, live events, courses curated by job role, and more from O’Reilly and nearly 200 top publishers.

