SUPPORT IN STRAIGHT-LINE RUNS
An article I read gave me an idea about searching for support and resistance in straight-line price runs. Testing the idea is one of the more boring aspects of writing this book, but I try to prove what I write. That is what makes my books different from others. I present new research or discuss existing techniques and prove their effectiveness. This section is part one of a two-part discussion of price behavior in straight-line runs.
I wanted to know how often a consolidation region in a straight-line run acts as support to price in the future. To simplify things, I am only interested in counting the first time price passes into a consolidation area and finds support.
Figure 4.6 shows an example of a straight-line run that starts at L (February) and leads to consolidation region A (circled). To the right of that area, which I show as the region between the two horizontal lines, is a spike at B that finds support (meaning it stops between the two lines). Point B is the first time that price drops to A. Region A marks a valid support area.
Figure 4.6 Support appears in a straight-line run.
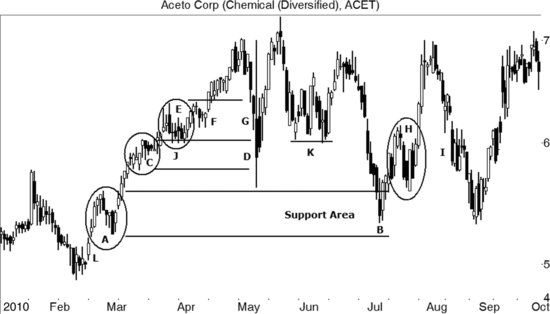
Price moves up to consolidation region C. Notice that price drops right through region C at D. However, circle E sits on top of C and pokes through the top of the region at J. Thus, circle C is also a valid support area because of the downward price spikes that stop ...
Get Trading Basics: Evolution of a Trader now with the O’Reilly learning platform.
O’Reilly members experience books, live events, courses curated by job role, and more from O’Reilly and nearly 200 top publishers.

