THE TRUTH ABOUT TRENDLINES
Since we have already mentioned trendlines, let us take a moment to discuss them. Draw up-sloping trendlines along valleys and down-sloping trendlines along peaks. The idea is to line up price so that it touches, but does not pierce the trendline, multiple times. When price does pierce the trendline, it is one indication of a trend change. It does not mean that the trend has changed from up to down or down to up, but it is a clue.
Figure 3.2 shows an example of trendline AB extended into the future. Price touches the trendline multiple times as it travels from A to B. A well-constructed trendline should have at least three touches, but just two will do in a pinch. As price develops, it touches the trendline at G but pierces it at H.
Figure 3.2 Trendline stops (circles) follow the stock higher.
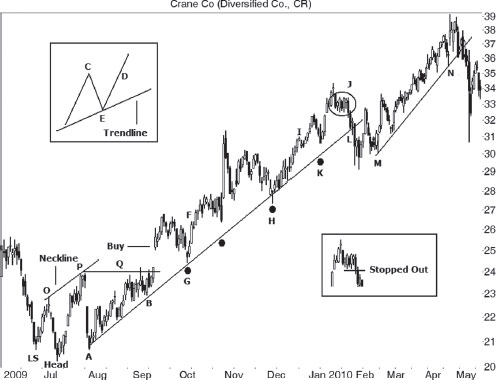
Notice that after price pierces the trendline at L, it bottoms and then begins trending again. It follows another trendline higher, MN, before piercing this one and dropping like granite through water.
I tested trendlines for my book, Trading Classic Chart Patterns (Wiley, 2002), so refer to that book for proof on what I list below. When I write, “outperform,” that is a measure of the price drop or rise after the trendline ends.
- Draw up-sloping trendlines along valleys; down-sloping trendlines along peaks.
- Trendlines with wide touch spacing (averaging 29 days ...
Get Trading Basics: Evolution of a Trader now with the O’Reilly learning platform.
O’Reilly members experience books, live events, courses curated by job role, and more from O’Reilly and nearly 200 top publishers.

