DECIPHERING TREND WITH VOLUME
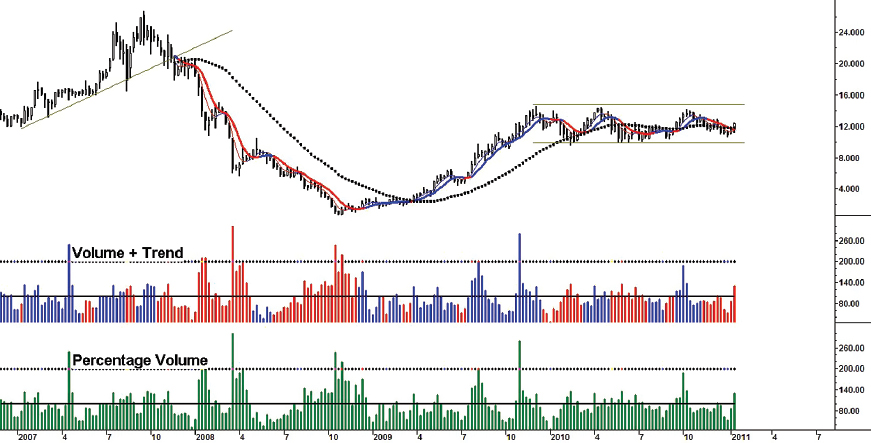
A trend directional system, shown in the middle window of Figure 5.9, may also be incorporated into the volume indicator. The lower window shows just the percentage plot of the volume indicator without the trend indicator. When the trend is weak, the color histogram of the volume plot is red, and it is blue when the trend is strong. A tall red histogram generally at the halfway point of the decline would indicate bearishness in the market, and a tall blue histogram would indicate bullishness.
FIGURE 5.9 The difference in the plots of a volume indicator. The lower window shows the normal plot of a percentage volume indicator and the middle window shows addition of a trend system to the volume indicator.
The formula for computing an indicator combining volume and trend in TradeStation format is as follows:
Get Timing Solutions for Swing Traders: A Novel Approach to Successful Trading Using Technical Analysis and Financial Astrology now with the O’Reilly learning platform.
O’Reilly members experience books, live events, courses curated by job role, and more from O’Reilly and nearly 200 top publishers.

