SAUCER PATTERNS
Saucer bottom formations belong to the group of patterns that seemingly have curve-line or rounding turns. Prices during the period of formation, especially at the rounding turns, have low volatility and move narrowly, forming a gradual bowl shape. Saucer bottoms are found at the end of a downward trend and are considered to be bullish reversal patterns. The initial downward slope indicates an excess of supply. The excess supply forces prices downward until buyers enter the market at the low price at the bottom, which increases the demand for the stock. Once the rounding is complete, the prices break out and continue in an upward trend.
Saucer patterns can also be referred to as cup-and-handle patterns when, upon a breakout of the pattern, prices retrace to form a right handle that drifts slightly downward. This pattern’s time frame varies from several weeks to several months. The longer it lasts, the more significant it becomes. (See Figures 3.25 and 3.26.)
FIGURE 3.25 In this chart, the completion of the saucer pattern coincides with the crossover of the 50-day moving average (50-DMA) over the 200-day moving average (200-DMA).
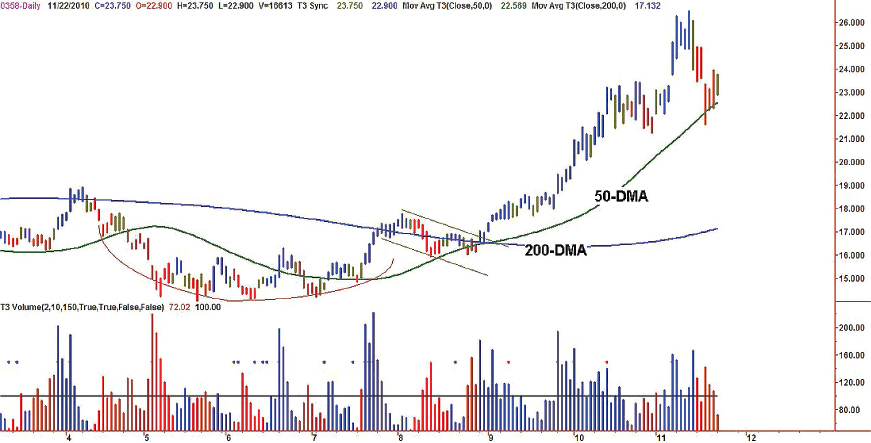
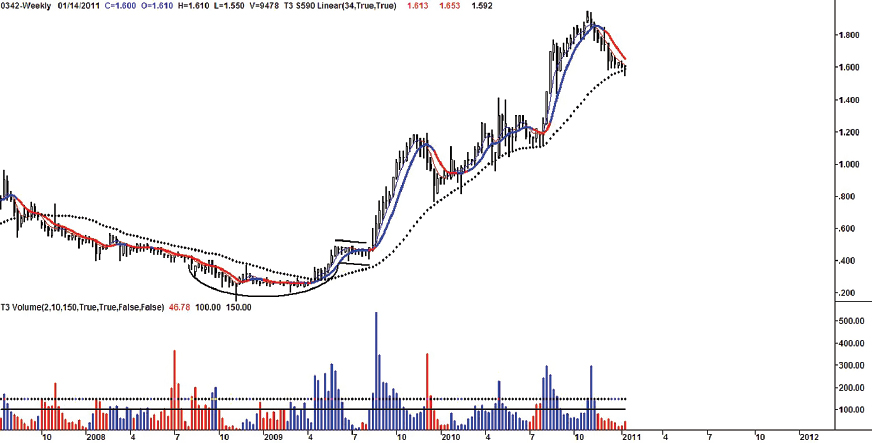
FIGURE 3.26 A typical cup-and-handle formation showing extreme volume upon breakout of the right handle of the pattern.
As prices move ...
Get Timing Solutions for Swing Traders: A Novel Approach to Successful Trading Using Technical Analysis and Financial Astrology now with the O’Reilly learning platform.
O’Reilly members experience books, live events, courses curated by job role, and more from O’Reilly and nearly 200 top publishers.

