CHAPTER 5
Volume
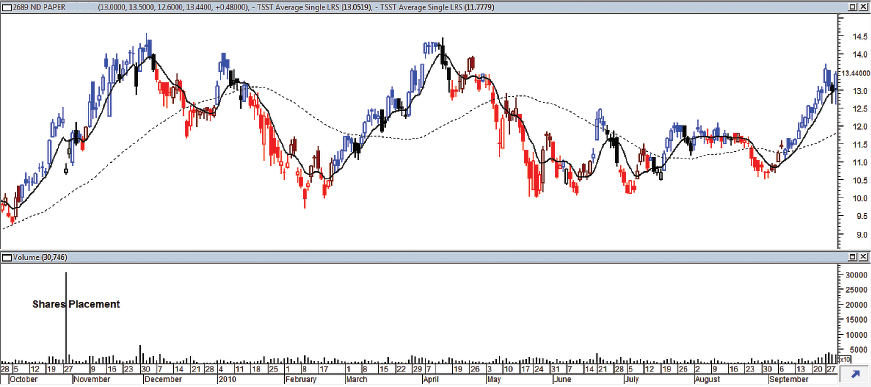
Volume represents the number of stocks transacted between buyers and sellers during a specified period, as shown in Figure 5.1. The period may be one day, one week, or one hour. The specified length of the period depends on the analyst. If we wish to arrive at a short-term view of the market, the price and volume should be analyzed daily or even hourly. On the other hand, a longer-term analysis would require a longer time frame. To determine the trend of volume, a running record should be maintained to compare the daily volume with previous figures. However, there is no standard rule as to the requisite number of days that should be used. Volume is generally plotted as a histogram below the corresponding price action.
FIGURE 5.1 The daily volume of the stock is shown in the bottom window. Note the huge placement of shares in October 2009, which suppresses the scale of the rest of the daily plots, making them difficult to read.
Get Timing Solutions for Swing Traders: A Novel Approach to Successful Trading Using Technical Analysis and Financial Astrology now with the O’Reilly learning platform.
O’Reilly members experience books, live events, courses curated by job role, and more from O’Reilly and nearly 200 top publishers.

