FINANCIAL TIME SERIES
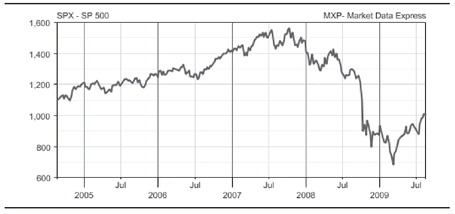
Let us first introduce some definitions and notation. A financial time series is a sequence of observations of the values of a financial variable, such as an asset price (index level) or asset (index) returns, over time. Exhibit 6.1 shows an example of a time series, consisting of weekly observations of the S&P 500 price level over a period of five years (August 19, 2005, to August 19, 2009).
EXHIBIT 6.1 S&P 500 Index Level Between August 19, 2005, and August 19, 2009
220
When we describe a time series, we talk about its drift and volatility. The term drift is used to indicate the direction of any observable trend in the time series. In the example shown in Exhibit 6.1, it appears that the S&P 500 time series has a positive drift up from August 2005 until about the middle of 2007, as the level of prices appears to have been generally increasing over that time period. From the middle of 2007 until the beginning of 2009, there is a negative drift. The volatility was smaller (the time series was less “squiggly”) from August 2005 until about the middle of 2007, but increased dramatically between the middle of 2007 and the beginning of 2009.
We are usually interested also in whether the volatility increases when the price level increases, decreases when the price level increases, or remains constant independently of the current price level. In this example, ...

Get The Theory and Practice of Investment Management: Asset Allocation, Valuation, Portfolio Construction, and Strategies, Second Edition now with the O’Reilly learning platform.

O’Reilly members experience books, live events, courses curated by job role, and more from O’Reilly and nearly 200 top publishers.