TRADING WITH THE NEW HIGH—NEW LOW INDEX
Whether you trade individual stocks or stock index futures, it pays to have an indicator that confirms market trends and warns of their upcoming reversals. When this indicator starts flashing signals that the stock market is about to turn, you should become especially alert to the technical signals in the stocks you hold.
I believe that the New High-New Low Index (NH-NL) is the best leading indicator of the stock market.8 New Highs are the leaders in strength—they are the stocks that have reached their highest point for the past 52 weeks on any given day. New Lows are the leaders in weakness—the stocks that have on that day reached their lowest point for the past 52 weeks. The interplay of new highs and new lows provides excellent information about the health or weakness of a trend.
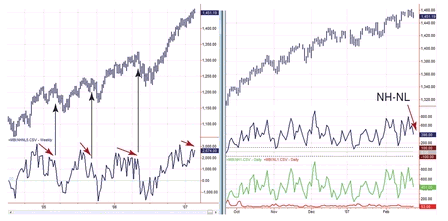
Figure 6.18 NH-NL, February 2007
090
Red line—new lows. Green line—new highs.
On the left side of the chart, you can see the S&P 500 climb to a new bull market peak while the weekly NH-NL, immediately below, traced a bearish divergence (marked with a red arrow near the right edge of the chart). Similar previous divergences, marked with vertical lines, have identified important tops within the bull market. On the daily chart you can see a minor bearish divergence of the daily NH-NL. The main sell signal comes from the weekly chart.
NH-NL is easy to construct. ...

Get The New Sell and Sell Short: How to Take Profits, Cut Losses, and Benefit from Price Declines, Expanded Second Edition now with the O’Reilly learning platform.

O’Reilly members experience books, live events, courses curated by job role, and more from O’Reilly and nearly 200 top publishers.