MY FAVORITE MAJOR BOTTOM SIGNAL
One of the most important patterns for identifying market bottoms is a false downside breakout accompanied by a bullish divergence. This pattern tends to deliver results in all timeframes, but of course the longer the timeframe the more important the signal. Here we will look for this pattern on a weekly chart—a timeframe which helps identify major tops and bottoms.
Research in Motion (RIMM) is a technology company whose Blackberry product is half-jokingly called “crackberry” for its addictiveness (Figure 10.6). The stock held up better than most in the early stages of the bear market, rising to a new high in 2008. That summer it popped above its resistance level but could not hold and closed below the resistance line in the area marked “1” on the chart. A bearish divergence of weekly MACD added to the gravity of that sell signal from a false upside breakout. It was all downhill from there for RIMM. Within a year, it slid from near $150 to below $40, losing three-fourths of its value.
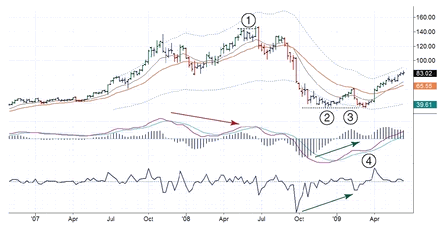
In October 2008, RIMM found support below $40 (area 2). It rallied in January 2009, with its MACD-Histogram crossing above the zero line, “breaking the back of the bear” (area 3). In area 4, RIMM fell back to support again, and then broke down to a new low. ...
Get The New Sell and Sell Short: How to Take Profits, Cut Losses, and Benefit from Price Declines, Expanded Second Edition now with the O’Reilly learning platform.
O’Reilly members experience books, live events, courses curated by job role, and more from O’Reilly and nearly 200 top publishers.

