THE TOP OF THE BULL MARKET
The stock market does not try to deceive or trick you. Think of an ocean rolling its waves onto the shore. You have to read the waves to understand when it is time to swim, surf, or sail and when it is time to drop everything and run for high ground. Learning the language of the ocean requires patience and experience. The market speaks to us in its own language of signs and signals. Interpreting its language is the task of technical analysis.
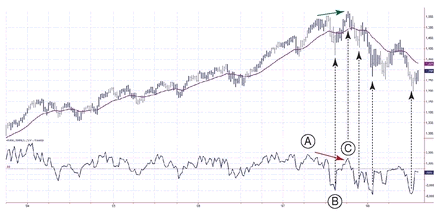
What were the messages of the stock market near its 2007 historic top? Let’s look at two weekly charts—one with NH-NL and the other with my favorite four indicators (remember Five Bullets to a Clip, which we touched upon in Part One).
Why begin with a weekly chart? This is a very important rule. The market is moving simultaneously in different timeframes. It may be trending up on the monthly chart, down on the weekly, up on the daily, and down on an intraday chart—all at the same time. Most people focus on a single timeframe, usually daily, and miss the depth of market’s messages.
I use the Triple Screen trading system, which requires me to begin by selecting my favorite timeframe. Since my favorite is the daily, Triple Screen prohibits me from looking at it—until I have examined the trend on a chart one order of magnitude longer. ...
Get The New Sell and Sell Short: How to Take Profits, Cut Losses, and Benefit from Price Declines, Expanded Second Edition now with the O’Reilly learning platform.
O’Reilly members experience books, live events, courses curated by job role, and more from O’Reilly and nearly 200 top publishers.

