THE BEAR WAS BEGINNING TO STIR IN ITS CAVE
By the middle of 2007, the bull market that began in 2003 was growing old. It is unusual for a full bull/bear cycle to last more than four and a half years, and by 2007 the clock was ticking louder and louder.
I believe that the New High-New Low Index is the best leading indicator of the stock market. The New Highs on any given day are the stocks that are reaching their highest price for the year. They are the leaders in strength. The New Lows for the day are the stocks that are falling to their lowest price for the year. They are the leaders in weakness.
If we compare all stocks listed on an exchange to soldiers in a regiment, then New Highs and New Lows are the officers. When this regiment attacks, watch whether its officers are leading the charge or running towards the rear. A well-led unit will win, and a poorly led unit will lose. Years ago, when I went through officer training, they kept telling us that there were no bad soldiers—only bad officers. I believe in that, and I always keep an eye on the New High-New Low Index.
To construct the daily NH-NL, subtract the number of today’s New Lows from the New Highs. To construct the weekly NH-NL, add up the daily NH-NL numbers for the last five trading days.
Figure 9.1 New High-New Low Weekly to mid-2007
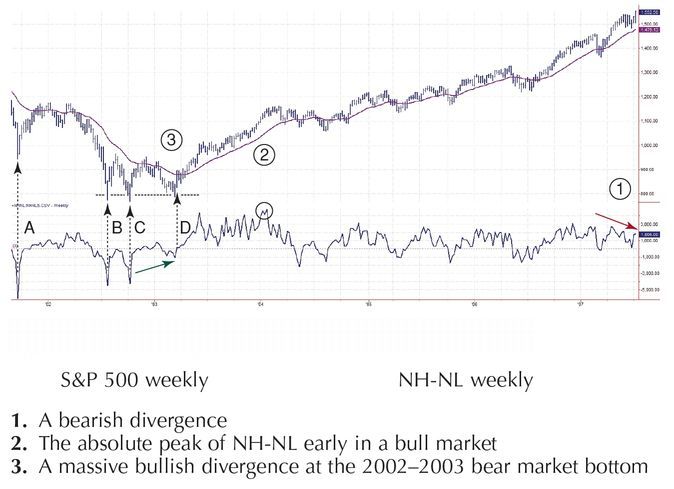
At the right edge of the chart (Figure 9.1) in zone 1, we can see that while ...
Get The New Sell and Sell Short: How to Take Profits, Cut Losses, and Benefit from Price Declines, Expanded Second Edition now with the O’Reilly learning platform.
O’Reilly members experience books, live events, courses curated by job role, and more from O’Reilly and nearly 200 top publishers.

