8.3 UNDERSTANDING NEWS FLOW DATASETS
Having cleaned the dataset, we were left with a sample of 90,000 news announcements from January 2001 onwards for companies within the S&P Large-Cap Europe universe (around 450 stocks). Figure 8.3 plots the time-series of news categories for a large-cap European universe. It shows that the majority of news items relate to company earnings news or guidance with the remainder equally split across other news categories. Figure 8.4 shows that news releases are not equally distributed across different calendar months. On average we find that just over half of all companies have some news reported each month, ranging from 30% at the beginning of the sample to 70% currently. We find that news stocks have a 60% chance of having more news in a subsequent month (be it good/bad news) and no-news stocks have a 30% chance.
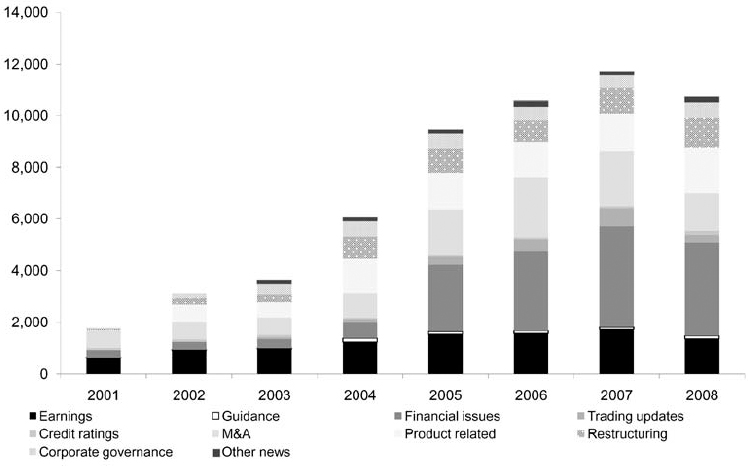
Figure 8.3. Categorizing news flow by year (source: RavenPack, Factiva, FactSet, Macquarie Quant Research).
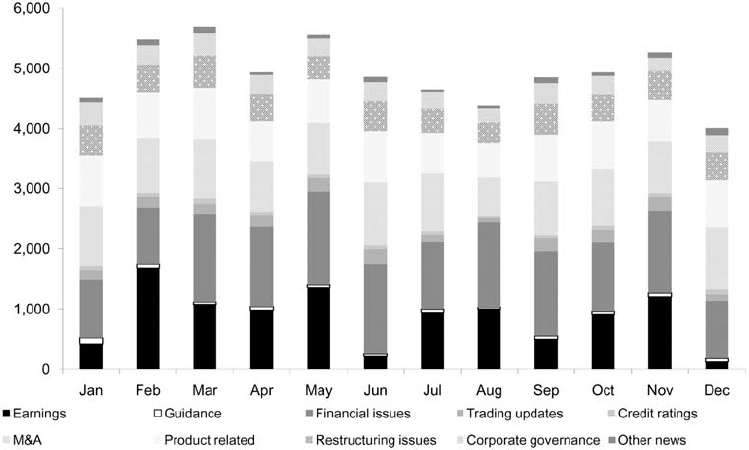
Figure 8.4. Categorizing news flow by month (source: RavenPack, Factiva, FactSet, Macquarie Quant Research).
We also find a statistically lower incidence of news reported on Fridays compared with the rest of the working week. Along a similar vein, academic research typically finds that Mondays and Fridays are light information days ...
Get The Handbook of News Analytics in Finance now with the O’Reilly learning platform.
O’Reilly members experience books, live events, courses curated by job role, and more from O’Reilly and nearly 200 top publishers.

