The most fundamental objective of any SEO project should be to drive the bottom line. For a business, this means delivering more revenue with favorable ROI. As a precursor to determining the level of ROI impact, the SEO practitioner must focus on increasing the volume of relevant traffic to the site. This is a more important objective than anything related to rankings or number of links obtained. More relevant traffic should mean more revenue for the business (or more conversions, for those whose websites are not specifically selling something).
Today’s web analytics tools make the gathering of such data incredibly easy. Two high-quality solutions are available that are completely free: Google Analytics and Yahoo! Web Analytics. These tools are sufficient for many smaller sites, though larger sites will probably need to consider a paid solution such as Omniture.com, IBM Unica NetInsight, or Webtrends.com.
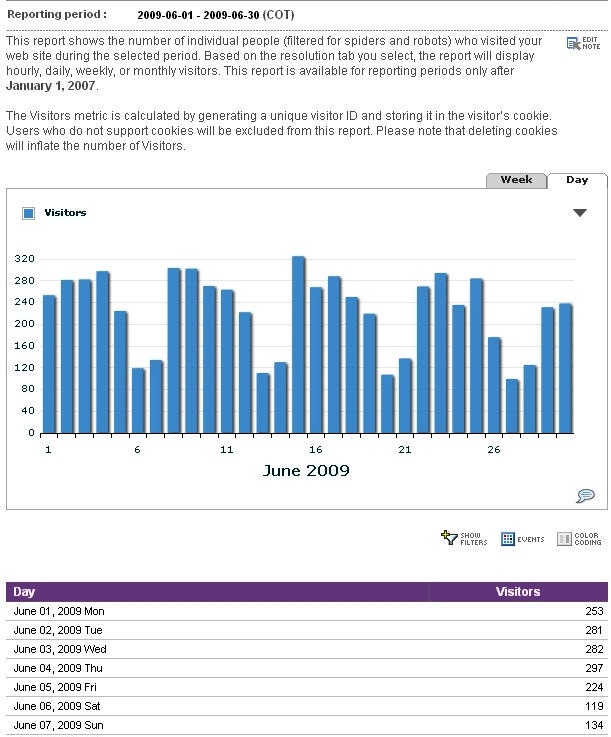
Figure 4-14 shows a sample of basic “unique visitors” data from Yahoo! Web Analytics.
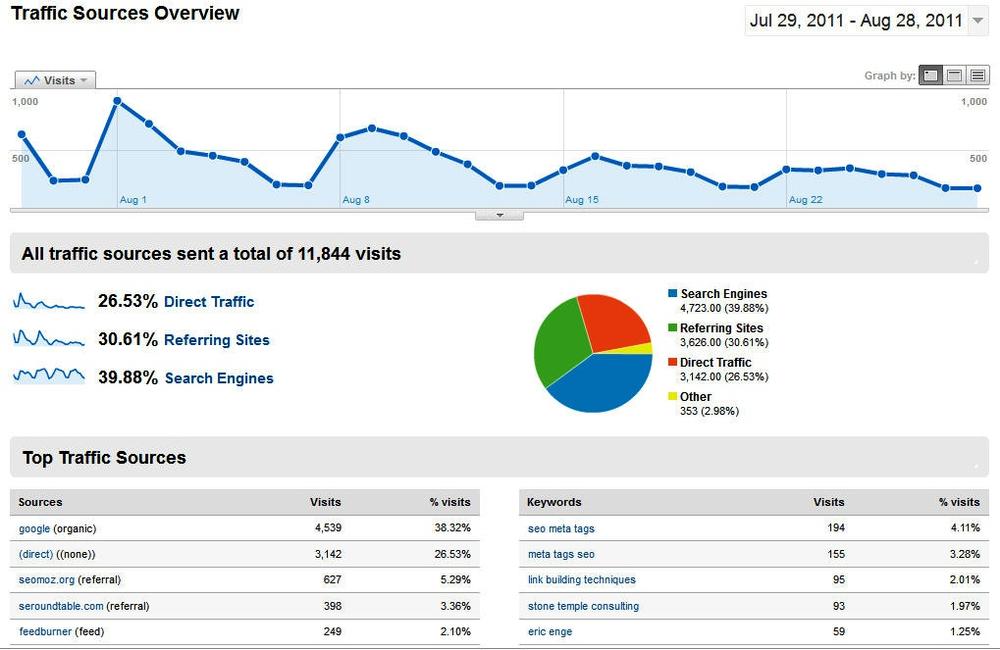
If you dig a little deeper you can see the sources of the traffic as well, as you can see in Figure 4-15, which shows a Google Analytics report.
As an SEO practitioner, it will be natural to want to delve into more detail—specifically, to break down the search engine traffic and understand that better as well. Once again, this is easy to do in both tools (and in most of the commercially available tools out there), as shown in the Google Analytics screenshot in Figure 4-16.
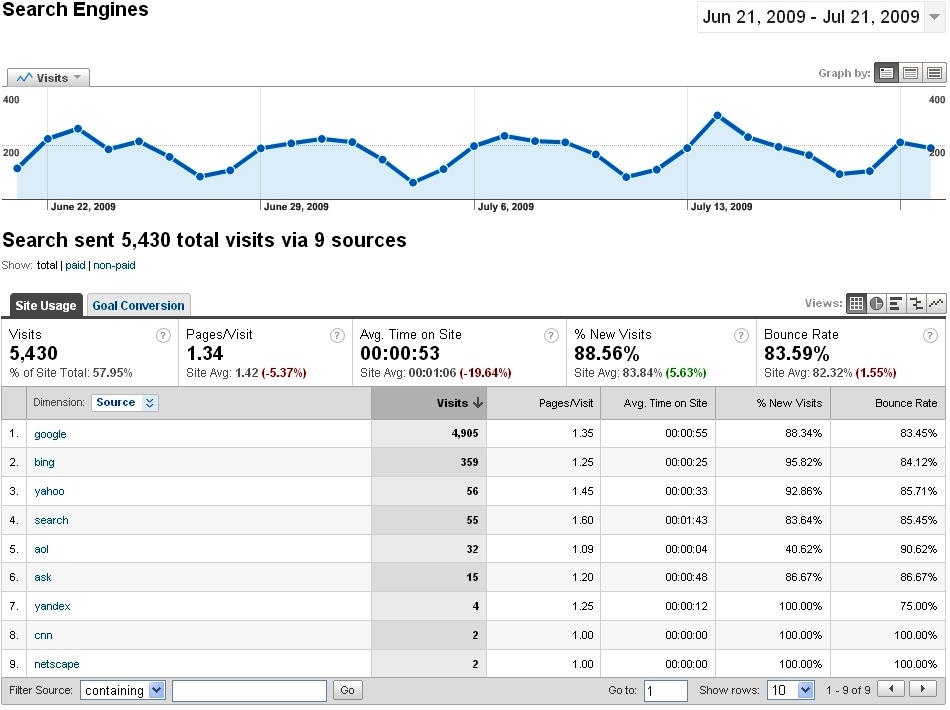
This type of data allows you to see which search engines are delivering the majority of the traffic to your site, and perhaps flag potential problems.
Also, over on the right of Figure 4-16 you can see that this site has an unusually high bounce rate. The site owner may want to investigate this in more detail to find out whether the visitors to the site are getting what they are looking for. The next step would be to drill down into the bounce rate metric at the page level and see if there are specific pages that have problems that can be resolved.
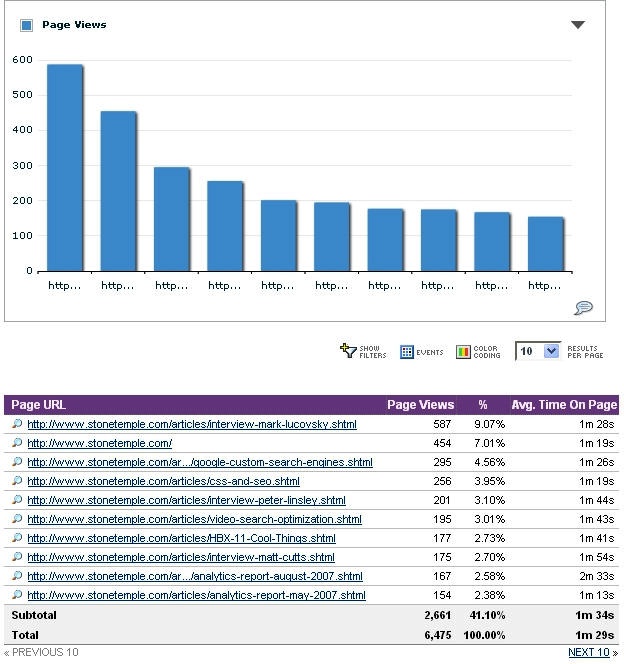
Yet another thing to look at is which pages are getting the most traffic. Figure 4-17 shows a sample report on that from Yahoo! Web Analytics.
In fact, the number of things you can look at in analytics is nearly endless. It is fair to say that there is too much data, and one of the key things that an SEO expert needs to learn is what data is worth looking at and what data is not.
Get The Art of SEO, 2nd Edition now with the O’Reilly learning platform.
O’Reilly members experience books, live events, courses curated by job role, and more from O’Reilly and nearly 200 top publishers.

