CHAPTER 3Data Visualization1
In my crystal ball, and I have several, if you look forward 5 or 10 years to 2020 or 2025... there are significantly more visuals and visual cues and fewer Excel spreadsheets. Today everybody has spreadsheets, and we’re kind of attached, but I think we need to be more visually data oriented because that will allow us to see more possibilities.
—Kathy Maher, Senior Vice President,Global Sales and Revenue, Wyndham Hotel Group2
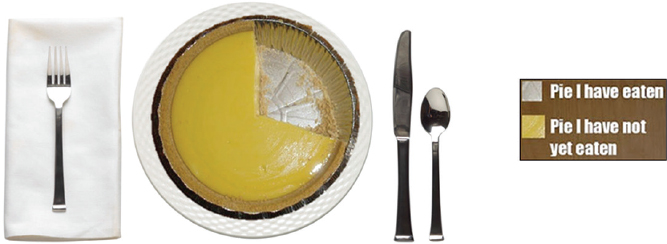
They say a picture is worth a thousand words. For data-obsessed analysts, it is easy to forget this simple statement. For managers attached to their spreadsheet reports, it’s even easier. Analysts love a good data set, and are extremely comfortable deriving relationships from rows and columns of performance data. Managers become so accustomed to scanning through their reports for their key performance indicators, they forget that there could be a better way. For most people, it’s difficult to see the forest for the trees in a complex chart full of numbers, particularly when they are looking at it for the first time. Using visualizations reduces complexity and allows you to tell more compelling stories with your data. If you really want to inspire others to take your recommended action, you aren’t going to do it with rows and columns full of numbers—you need to tell a highly visual, simple, and compelling story with that data.

Figure ...
Get The Analytic Hospitality Executive now with the O’Reilly learning platform.
O’Reilly members experience books, live events, courses curated by job role, and more from O’Reilly and nearly 200 top publishers.

