Chapter 1. Introduction
“So…what do you do?”
“I’m a social network analysis researcher.”
“Oh, so you play on Facebook and get paid for it?”
This dialogue occurs frighteningly often in the life of any SNA researcher. And the answer of “Yes, but it’s much more than Facebook” does not cut it. In fact, SNA is an extremely versatile methodology that predates Twitter and Facebook by at least 30 years.
In a few words, Social Network Analysis (SNA) can be described as a “study of human relationships by means of graph theory.” However, this sentence leaves a lot to be unpacked.
In a way, SNA is similar to many statistical methods. The fact that economists use regression analysis extensively doesn’t mean that the technique is limited to the study of economics. Similarly, while studying the social media is a great way to apply SNA techniques—not only is the data easily available, but the opportunities for studying are numerous and lucrative. In fact, I am willing to bet that 9 out of 10 of my esteemed readers have picked up this book for this very reason.
Ten years ago, the field of social network analysis was a scientific backwater. We were the misfits, rejected from both mainstream sociology and mainstream computer science, applying strange mathematical techniques to strange sorts of data and coming up with pretty pictures that were very hard to read and results that made sense only within our narrow community. Social network data was difficult to gather and hard to come by (see Appendix A); most students in the field worked from a small standard set of datasets and rarely ventured out to build their own data. The advent of the Social Internet changed everything. Every day, Twitter generates more social-network data than our entire field possessed 10 years ago; every social media site provides an API for easy retrieval of data; many governments of the world are releasing data that lends itself to SNA techniques.
In this book, we will analyze social media data. We will harvest data from Twitter (Appendix A), from Facebook and LiveJournal. We will learn to recognize online communities, and study the anatomy of a viral video and a flashmob.
However, I will show that SNA can be applied in many different ways. In this book, we will look at the social media, but we will also look beyond social media. We shall study the relationships between companies through investment networks and through shared boards of directors. We will look inside an organization and discover how the social network around the water cooler and lunchroom affects the company’s ability to perform—and how a company could shoot itself in the foot by ignoring this. We will look at campaign finance and discover how a single special-interest group can control the outcome of an entire election. We will explore the world of terrorists, revolutionaries, and radicals—from stories of the Khobar Towers bombing in 1998 and the 9/11 attacks, to the recent uprising in Egypt. We shall look at the anatomy of fads and trends—which are often mediated by Twitter and Facebook, but are offline phenomena by nature.
I will show you that network data is everywhere—you just need to learn to recognize and analyze it. And once you do, new insights and ideas shall follow.
Analyzing Relationships to Understand People and Groups
The science of Social Network Analysis (SNA) boils down to one central concept—our relationships, taken together, define who we are and how we act. Our personality, education, background, race, ethnicity—all interact with our pattern of relationships and leave indelible marks on it. Thus, by observing and studying these patterns we can answer many questions about our sociality.
What is a relationship? In an interpersonal context, it can be friendship, influence, affection, trust—or conversely, dislike, conflict, or many other things.
Binary and Valued Relationships
Relationships can be binary or valued: “Max follows Alex on Twitter” is a binary relationship while “Max retweeted 4 tweets from Alex” is valued. In the Twitter world, such relationships are easily quantified, but in the “softer” social world it’s very hard to determine and quantify the quality of an interpersonal relationship.
A useful stand-in for strength of an interpersonal relationship is frequency of communication. Besides being objectively measurable, frequency of communication has been found by scientists to reflect accurately on the emotional content, and amount of influence in a relationship. This would, of course, not be true in many contexts (and you, my dear reader, are probably busy coming up with counterexamples right now)—but in many cases, for the lack of better data, frequency of communication works.
Symmetric and Asymmetric Relationships
It is easy to see that some relationships are asymmetric by nature. Teacher/student or boss/employee roles presume a directionality of a relationship, and do not allow for a symmetric tie back. Following on Twitter and LiveJournal is directional by definition—but a follow-back tie can exist, thus symmetrizing the relationship
Other relationships are symmetric. Facebook friends and LinkedIn connections require mutual confirmation—the software forces a symmetry even when the real human relationship is asymmetric.
In the real world, friendships and romantic relationships are asymmetric, as much as we would like them not to be that way. Hence, we struggle with unrequited love, one-sided friendships and other delusions of popularity. Given good data, we can study these phenomena using SNA—but such data would be very difficult to obtain and subject to self-reporting and other biases.
Multimode Relationships
Finally, we should mention that relationships can exist between actors of different types—Corporations employ People, Investors buy stock in Corporations, People possess Information and Resources, and so on. All of these ties are described as bimodal or 2-mode—we will discuss them in detail in Chapter 5.
From Relationships to Networks—More Than Meets the Eye
If a traditional quantitative sociologist or econometrician got a hold of social network data, he would approach it as follows:
What can we learn about the respondents? Is there any demographic data on them? Age, race, religion, income, education, location, and so on—any qualitative or quantitative variables that could possibly be measured.
What kind of quantitative metrics can be derived from the network data? Most likely, these metrics would include various forms of centrality (see Chapter 3).
What kind of quantitative or qualitative outcomes can be measured? That is, the ability to integrate into a society as a citizen, the likelihood of trying illegal drugs, etc.
Then he would build a multivariate regression model, controlling for some variables and linking some of the other variables to outcomes. This is a perfectly valid approach—in fact, this approach still gets a lot of mileage in the SNA conferences.
One of the traditional applications of this approach is the notion of homophily (Greek, meaning love of the similar)—or, loosely, the notion that “birds of a feather flock together.” For example, it has been proposed that people of a similar age are more likely to be friends than people of different generations, or that people of the same race tend to associate together. While some of these conjectures ring true, they do not account for such things as the complexity of internal dynamics of social groupings between black teenagers in one high school class—where age, race, economic background, music preferences, etc., may all have a high degree of similarity, and yet emotions run the full spectrum of human conditions from love to rage.
However, we can do something that is remarkably different and, I dare say, better.
The standard statistical approach has one assumption—that of event independence, or a Poisson process.[1] In a Poisson process, every event can be treated as a completely independent occurrence, with no relationship to other events. Thus, we can compute probability of an event based on outside variables or characteristics—and as a result, come up with a decent model of reality. Of course, events are not always independent—in which case, Bayesian statistics can create chains of dependencies and compute the probabilities of macro-outcomes. Details of this are beyond the scope of this book, but can be found in a variety of sources.
In a social network, we intuitively know that there are no independent events. People form friendships and acquaintances through introduction—i.e., A meets B because A and B both know C. There are love triangles (which, in the view of homophily, should become more like a free-love commune!). There are long-range ties to unlikely others, on the basis of homophily.[2] And counter-examples multiply.
When we do SNA, we remove the independence assumption and treat all ties as potentially dependent on each other. This makes traditional statistical methods (e.g., regressions, or Markov Models) mathematically intractable on all but most trivial problems—but have no fear, we shall develop and deploy new methods that are just as powerful. We shall talk more about homophily in the context of information diffusion in How Does Information Shape Networks (and Vice Versa)?.
Social Networks vs. Link Analysis
Another cousin to SNA is Link Analysis (LI). Some of you may have used LI in business intelligence or law enforcement work, or seen it on TV. “Without a Trace” uses link analysis in every episode; “Numbers” and “Law and Order” resort to it on occasion.
Link analysis is in many ways similar to SNA—both talk about relationships in terms of nodes and edges (Figure 1-1) and both try to derive the idea of who is more important in a network by analyzing the whole network, not individual events.
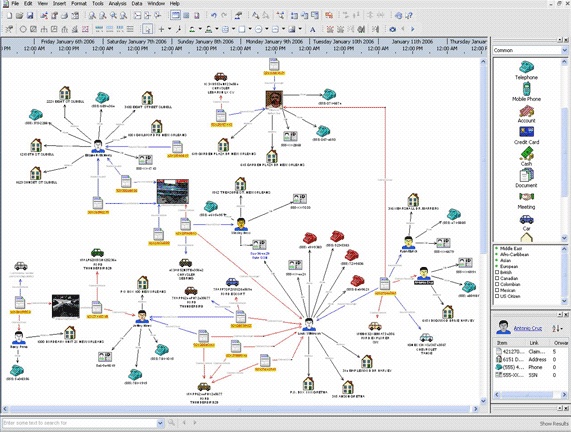
However, LI allows for a mixing of different node and edge types in the same network—i.e, “A gave $300 to B to procure drugs for C”. In this example, bold words are nodes, or actors, and italic are actions, or edges. The problem is understanding on a quantitative level whether the act of giving money is different than the act of procuring drugs—and thus LI relies on human-level understanding of language and is qualitative in its pure form.
Most link analysis tools, including Analyst’s Notebook and Palantir, include qualitative data gathering and tools for qualitative decision-making, and these are excellent and utilized widely in a number of communities. However, the application of quantitative metrics centrality measures is dangerous because mixing nodes and edges of different meanings (e.g., money and telephone calls) produces a result that is mathematically invalid. Unfortunately, this does not stop the software from computing these metrics. [3]
The proper way to address this is using multimode networks (which we discuss in Chapter 5), which is precisely what we are going to do.
The Power of Informal Networks
Let us start discussion of social network analysis with a little story.
ACME Consulting was an old auditing shop. Founded in the 1960s, it was a family-owned business for more than 25 years. The firm grew slowly and organically for many years, and was the owner’s pride and joy. ACME’s main business was accounting and auditing—serving a few select, reliable clients. In the mid-1990’s, ACME succumbed to the lure of the information age, and added an IT department that built all of the infrastructure needed for running a “21st century operation”—but the core of the business was old-fashioned, with a nose-to-the-grindstone understanding of the paperwork and the numbers.
However, all good things must come to an end, and the owner, nearing his retirement years, decided to move to Boca Raton and embark on a new career of fly fishing and being a full-time grandfather. He didn’t want to sell the business, and instead hired an outside CEO to run the company while the family remained nominally in control.
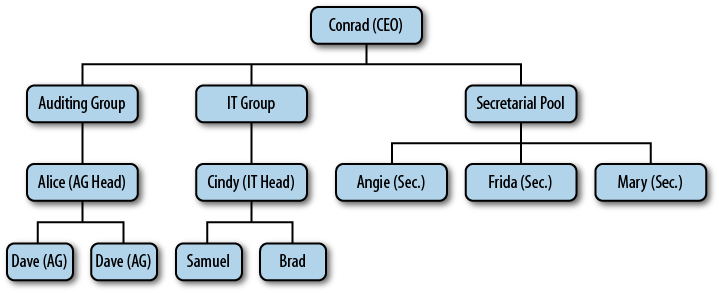
The org chart in Figure 1-2 shows how the CEO (Conrad) saw his company. The auditors and the IT groups formed their own divisions, of about 100 people each (the org chart below is greatly simplified). Separate was a “secretarial pool”—a group whose sole responsibility was dealing with mountains of paperwork that the firm handled for clients. In a way, this was a vestige of the “Mad Men” world—some of the older auditors still referred to the secretaries as “girls,” despite the fact that many of them were in their 50s. The departments bickered with each other over resources and requirements, problem resolution took far too long and required too many meetings, and cost the company many billable hours.
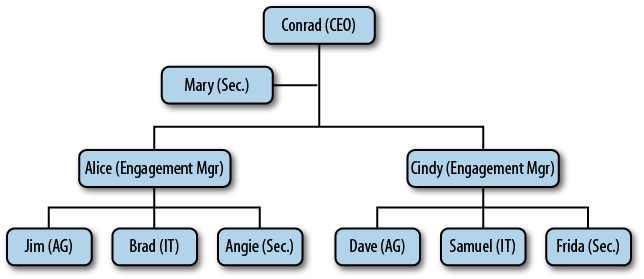
This way of doing business didn’t sit well with CEO Conrad, a young graduate of a prestigious business school. He wanted to build a modern, client-oriented, responsive organization. Shortly after his arrival, ACME was reorganized. Every client account was now assigned an “engagement manager” and was served by a cross-functional team that handled all of the work, from server installation to filing tax returns. The secretarial pool was dissolved, and its functions were distributed to client sites. You can see the new org chart in Figure 1-3.
On the surface, the change was good. The project teams finally got to know their clients; finance and IT people finally talked to each other and realized that they were not actually born on different planets, routine problems got resolved in hours instead of weeks. Customers were happier. But under the surface, trouble was brewing.
Over time, Conrad noticed that each of the project teams spent more and more time “firefighting”—fixing previous mistakes. Tracking the kinds of mistakes, he realized that many of them had to do with improper forms being filed with the government, misplaced documents, and other concerns that we would call “routine paperwork”—things that used to be handled by the secretarial pool. The final straw was a major mistake that nearly landed ACME on the front page of the Wall Street Journal. Then, Conrad did what any manager in this situation would do—he hired a consultant.
Let us now trace what the consultant did, and repeat after him.
If you have not yet installed the tools of our trade—Python and
NetworkX—I will now refer you to Appendix B for
installation instructions. Once you have installed all the necessary
software and libraries, please open your Terminal and clone the GitHub repository,
and “cd” to the working directory. At the prompt (%), type python to launch the Python command line
interpreter. You will be given a prompt (>>>) at which you can type and execute
individual Python statements:
% python
>>> import networkx as net
>>> import matplotlib.pyplot as plot
>>> orgchart=net.read_pajek(“ACME_orgchart.net”)
>>> net.draw(orgchart)
You should now see something similar to the picture in Figure 1-4. The hierarchical layout of ACME is evident with Conrad in the center, flanked by project teams led by Cindy and Alice.
The consultant was not content with seeing the formal structure of the organization, and instead proceeded to talk to the employees about the company and the way things were done “in the old days” and after arrival of the new CEO.
The questions he asked were simple:“Who gives you advice?”, “Who do you trust?”, and “Who do you socialize with after work?”.
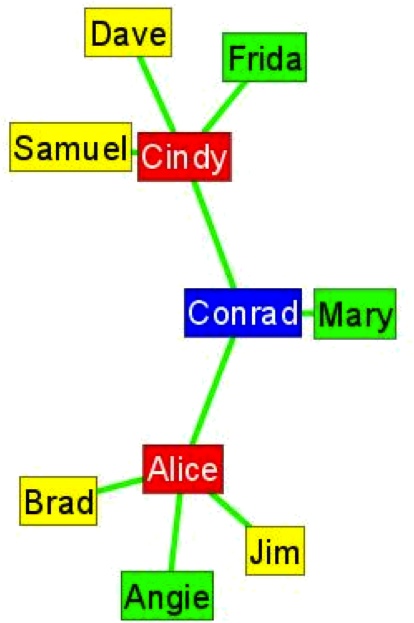
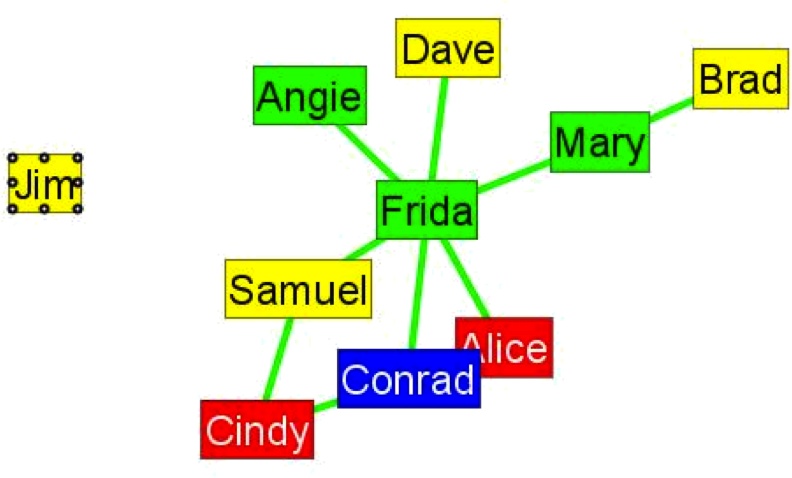
The results were nothing short of astounding—at least to the CEO. The real network of ACME was not even close to its organizational chart, and it revealed the crucial mistake made by Conrad (see Figure 1-5). Let us reproduce this figure:
>>> advice = net.load_pajek(“ACME_advice.net”)
>>> net.draw(advice)
In the informal network, the most trusted person was not the CEO (who was still seen as an interloper), nor one of the managers—but Frida, one of the secretaries from the “old girls club.” A closer examination showed that Frida was one of the oldest employees of the firm, and was regarded as a mentor by almost everyone else. After more than 20 years with ACME, Frida had accumulated both factual and tacit knowledge that made the firm stable. However, in Conrad’s reorganization, she had been moved to an offsite client team, and her advice became unavailable on a day-to-day basis.
This story has a happy ending. Frida was promoted and stayed at the headquarters as a trusted advisor, training the younger employees—and the company rapidly recovered.
This story serves to demonstrate that informal networks matter, more than many managers would like to admit. Every organization has information bottlenecks, rumor mills, competing cliques and other potential problems that only Social Network Analysis can detect.
I tell this story every time I teach Social Networks to various audiences—from graduate students to government officials. On more then one occasion, people have asked me “So how do you stop informal networks from happening?”. It is in fact impossible to do so.
Terrorists and Revolutionaries: The Power of Social Networks
Informal social networks emerge in the harshest conditions, despite all efforts to prevent them. Just like the Internet, social networks tend to route around damaged connections and restore communications.
Social Networks in Prison
In the infamous Butyrka prison in Moscow, the authorities strictly forbid communication between cells. The wall are too thick to allow yelling from cell to cell, there is no common exercise yard, and every attempt at communication detected by authorities is punished by solitary confinement. One cannot imagine a harsher environment for maintenance of an informal social network. Nevertheless, over the years an intra-prison mail system (“malyava”) has evolved that allows letters and small packages (Figure 1-6) to be moved from cell to cell undetected.
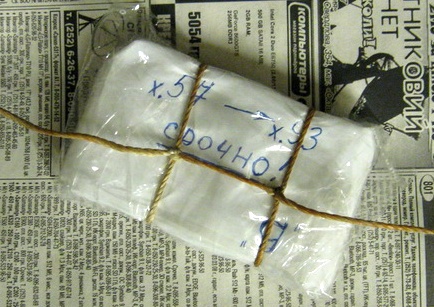
It works essentially as a packet-switching network. A system of point-to-point links moves “packets” on long loops of string (called “roads”) through the windows and over the outside walls (packages must be small enough to fit through the bars). If an outside “road” is not available, a package may be pulled through the sewer pipes after being waterproofed with a plastic bag. The packets are then either received and read, or routed on to the next cell—until they reach the intended recipient. The “roads” are disrupted whenever authorities find them—but can be reestablished in a matter of hours. Over time, as prisoners are moved to other cells, shipped to serve the rest of their sentence in Siberia, or released, the network adapts and is continuously optimized for reliability.
This system even allows for broadcast messages (e.g., “such-and-such has been snitching to the authorities; whoever sees him next should punish him”) and runs on a strict set of social norms (“thieves’ law”) enforced by the inmates with extreme violence. [4]
While the “malyava” system works well within an individual prison, contact must be maintained with other prisons (e.g., for prisoners shipped to jails in Siberia). This is much more difficult—the process of moving a prisoner to a faraway prison camp involves many searches that make shipping a letter or a package with a courier nearly impossible. Thus, important information gets communicated by word-of-mouth through trusted people—usually professional criminals with many prison terms behind them. The information migrates from one medium to the next and, if needed, is disseminated along the way.
This, for example, ensures that an informer cannot hide from the “thieves’ law” no matter where he goes—information about his deeds will eventually reach any prison camp he might be sent to, guaranteeing a violent outcome. The informal network also serves more peaceful purposes, letting experienced criminals consult with younger ones in the profession, resolving property disputes, and establishing a firm set of norms of behavior that is remarkably civilized for the population.
One curious aspect is that the Soviet government originally encouraged (or pretended not to notice) the development of this code of behavior—as it helped the authorities keep the Gulag system under control, and marginalize political prisoners to the advantage of the professional thieves.
Informal Networks in Terrorist Cells
The Al Qaeda manual of operations states that a cell preparing an attack should be small, not more than 6 members. The members of the cell live together in a safe-house and only leave it to go on reconnaissance or supply missions, and maintain little or no ties to the community. Only the cell leader possesses information about contacts and supply routes within the larger organization—which minimizes the risk of exposure should some of the operatives (frequently young and badly trained) be caught.
Warning
The manual is available from the US Department of Justice or the Federation of American Scientists at http://www.fas.org/irp/world/para/manualpart1_1.pdf. Please be careful when downloading on corporate or government networks as possession of this document could be misinterpreted.
Let us walk a little bit through the logic of this network:
Sequestering a small group of people inside a safe-house ensures that the operatives will bond with each other to the exclusion of their own families or outside connections. These bonds act as a positive feedback loop, helping extremist ideology to be accepted and amplified within the group. We will discuss these amplification loops in Chapter 4.
Keeping the group small, while an obvious limitation to the size and complexity of the operation, allows everyone in the group to constantly monitor everyone else, and not leave a hiding place where a single individual may communicate with the outside world and give away the location and plans of the cell.
Keeping a single connection to the outside world through the cell leader allows the organization to control (as well as filter and distort) all information that goes in and out of the safe-house, making the operatives fully dependent on the organization for survival.
I used the operations manual and a number of other sources to build a model of social network structure similar to that of a terrorist network.[5] One such simulated structure is shown in Figure 1-7. In this network, two separate groups of operatives are preparing two separate attacks—a group on the right headed by Agent 6 and a larger group on the left headed by Agent 36.
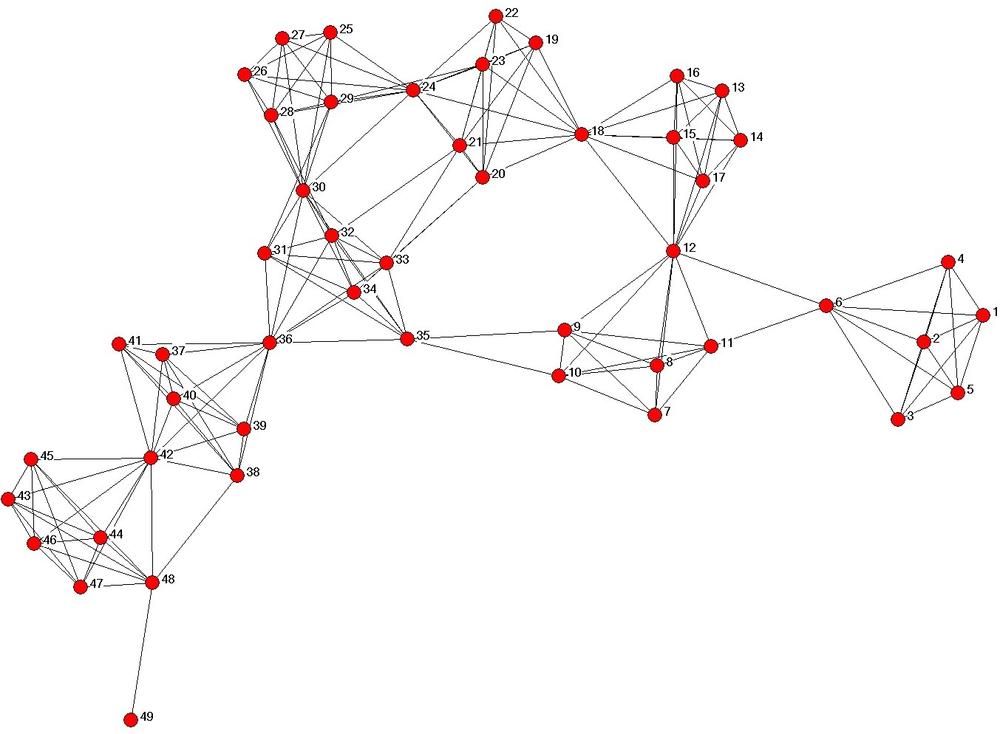
Intuitively, if a law enforcement or military officer is shown this picture, he would recognize agents 6 and 36 as leaders—or important in some way—and propose that they be targeted for an offensive operation (whether it is an arrest or a drone strike). In fact, this is one of the most common ways social network analysis is applied in the counter-terrorism community. The leader of the cell is indeed a weak spot and his removal presents a significant problem for the operatives—but, in fact, the informal network of the terrorist organization is capable of quickly recovering from such an attack.
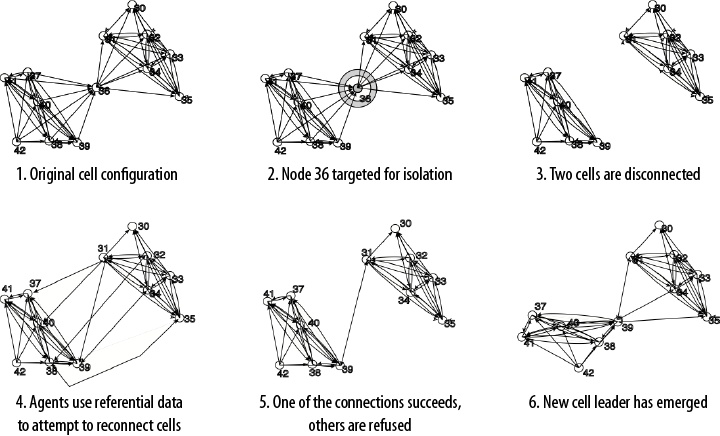
Figure 1-8 shows this adaptation process after an attack. In step 3, Agent 36 is removed, leaving a large group of operatives without a connection to the main body of the organization. However, each of the agents inside the cell possesses some informal knowledge of other individuals in the organizations—perhaps through training camps, or family ties. After the attack on Agent 36, a chaotic frenzy of informal connection attempts ensues; most of these informal connections do not succeed. However, once a successful connection is made, the entire group of operatives is reconnected to the main organization, largely undoing the effects of the drone strike. In my simulation, this process takes approximately a week.
The Revolution Will Be Tweeted
The revolutions that shook the Arab world in the winter of 2011 are frequently described as “Twitter Revolutions”. They are not the first political uprisings mediated by online social networks—the first successful one was in Moldova in 2009;[6] one also cannot underestimate the role of Twitter in the suppressed Iranian uprising. However, the revolutions in Tunisia and Egypt presented the biggest and most public challenge to the existing world order.
Social Media and Social Networks
How did social media become so powerful? How did it graduate from sharing pictures of cats to toppling governments?
The answer lies in the social media’s ability to maintain and amplify weak ties. Weak ties are defined as social connections between people that require little or no emotional attachment, some agreement on basic terms (but low overall similarity), low frequency of communication—in short, they require little or no personal time and energy to maintain—yet are extremely powerful. Mark Granovetter, in his groundbreaking paper,[7] shows how weak ties in an interpersonal network (not mediated by Twitter or Facebook) can carry information across vast distances both physical and social (in terms of income, class and attitudes). Low emotional content of such ties allows people to hold very different opinions on many topics without engaging in a conflict; low frequency of communication means that the two people are usually desynchronized in terms of what information they receive and when. Thus, when two people do communicate across a weak tie, the information that passes through it is usually novel, and comes from a different point of view. Granovetter showed that weak ties are extremely important in a job search; people that one was strongly tied to tended not to possess any novel information about job openings, but people across weak ties had access to very different information and could make far-ranging connections.
With all of the power of a weak tie, its probability of being useful is fairly low—while the cost of maintaining the weak tie is non-zero (in terms of time investment). Furthermore, the human species seems to have a biological limitation to the number of people they can maintain a tie to. Robin Dunbar states that our cognitive limit is, in fact, only 150.[8] The variance of this number is quite high, as we all know gregarious individuals who seem to know literally everybody—but secondary evidence supports that a qualitative shift occurs in organizations, villages, military units, etc., when they grow beyond 150 individuals (i.e., beyond the number that everyone could keep in their heads). Nevertheless, no matter what the real number is, the theory still holds.
Why do we talk about this in context of Twitter? Social networking sites help minimize the time and cost of maintenance of a large number of weak ties (it is much easier to update your Twitter status and read a stream of updates than to call every one of your friends daily and ask how they’re doing)—and thus increasing the potential number and reach of these weak ties. Moreover, the one-sided “follow” relationships of Twitter allow for non-reciprocal relationships and broadcast communication—thus Twitter can quickly turn ordinary people into celebrities. They just have to be at the right place at the right time.
Take the example of @ReallyVirtual, an IT consultant who accidentally live-tweeted the raid against Osama bin Laden’s compound in Abottabad. The morning of the attack, he had a small number of followers (measured in the 100s)—which shot into tens of thousands as major media outlets found out about him and publicized his Twitter account. Currently, he has close to 100,000 followers—but does it really mean that he has 100,000 relationships? Not really—these are weak ties that have been precipitated by a single event, a Warholian 15-minutes-of-fame moment.
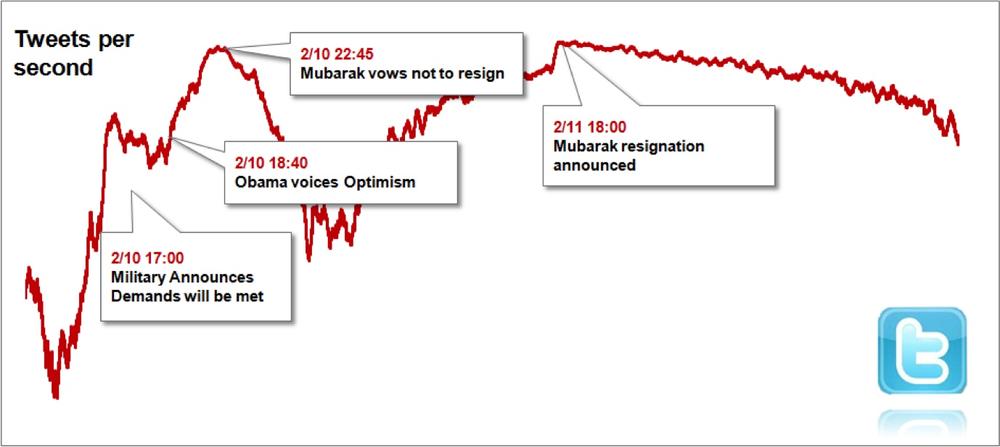
Egyptian Revolution and Twitter
Now let’s return to the revolution in Egypt, and analyze the Twitter traffic over February 24-25, 2011. Figure 1-9 shows the dynamics of Twitter posts from Tahrir Square on the eve of Mubarak’s resignation. While it is obvious that every newsworthy event culminates with a spike in Twitter activity, it is also interesting to observe that major events also include a run-up in number of tweets in the hours preceding the event—reflecting the rumors and “buzz” of the crowd expecting something major to happen.
However, let us dive a little deeper into the social networks that helped Egyptian revolution to happen.
We at DeepMile Networks [9] collected the data on the Egyptian revolution as the events were unfolding. We were mainly interested in mapping out the process by which people in the streets of Cairo were exchanging information and influencing each other.
We consider a retweet to be the basic unit of influence on Twitter. It represents information that has been received, internalized, and passed on to others. If we follow the history of every message, video, tweet, etc., in the online universe, we’ll find that by far the largest majority of messages get no reaction whatsoever—and a very small number “go viral”—that is, get diffused to a large number of people.
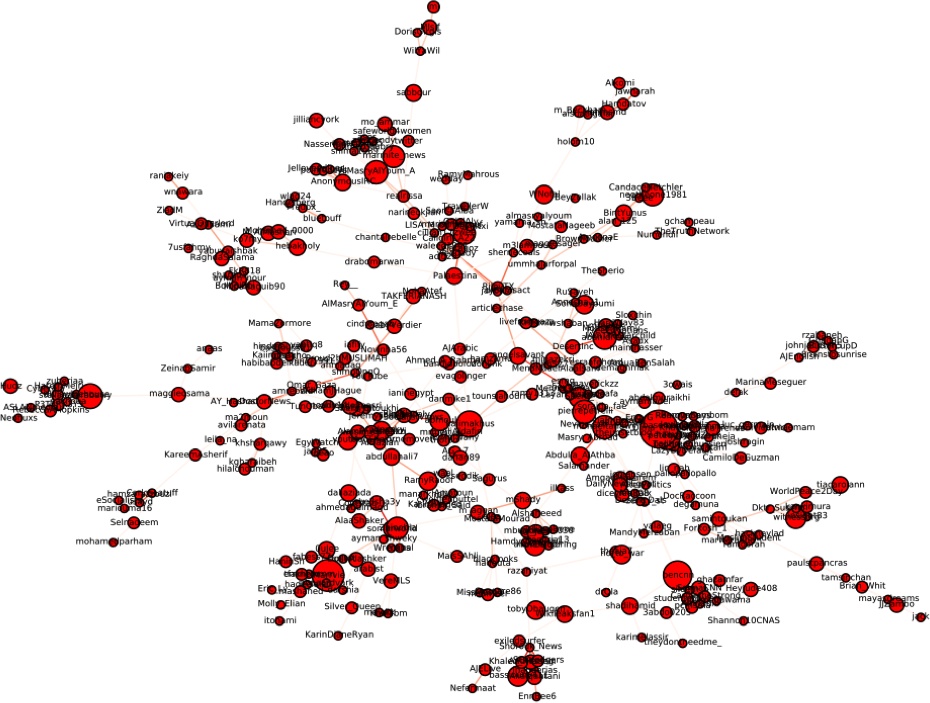
The picture in Figure 1-10 shows a portion of the retweet network that we have observed.[10] A link between two people in the network represents that some retweeting has occurred between the two people; we find that over time people tend to retweet from others that they trust—so, collected over time, this network becomes a proxy for trying to understand who trusts whom. A number of clusters of dense retweeting activity has formed in the network, with some of the clusters having several hundred members passing information to each other. Some of the clusters are geographically distributed (some are in Egypt, others are in France and the US), others represent different topics—anything from movement of security forces to searching for a toilet in the vicinity of the Tahrir Square.
In tracking the retweets from Tahrir Square, we found that a small number of people were able to generate disproportionately larger response to their tweets than anyone else. This did not depend on the number of followers that a person had—rather, the biggest determinant of being influential is whether a person is embedded in a dense cluster of like-minded people.
Compare the two networks in Figure 1-11. These networks were extracted from the large network dataset that we collected and are centered on two prominent individuals that have voiced their opinions on the Egyptian Revolution. On the left is Wael Ghonim, a Google employee that became one of the central figures over the course of events. At the time of the revolution, he had 80,000 followers—however, his tweets generated 3200 reactions each. To compare, we have found the person with the largest number of followers in the network—Justin Bieber. With his cadre of 7.5 million followers, he generated only 300 reactions per tweet.
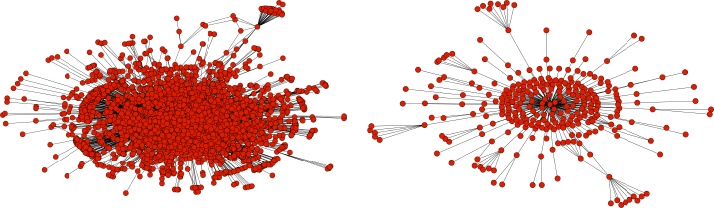
Following the same reasoning, we drilled further into the data and realized that a large number of individuals that were deeply embedded into the dense communities and clusters were responsible for generating and spreading the information. The conclusion of our study was that the revolution was not broadcast by celebrity or well-known voices—the messages found a resonance chamber inside the dense clusters populated by everyday people.
In short, this is a praise for the network “middle class”—not the celebrities, not the inactive lurkers—but people who only have a medium number of followers, but actively maintain their networks by investing time into them by following up on and responding to messages. Together in a dense cluster, this middle class formed a formidable force in Tahrir Square.
We shall spend more time on information diffusion and “viral phenomena” in Chapter 6, after we have established a solid base of tools and understanding to undertake influence analysis.
[2] Yours truly is friends with both people on the radical left and radical right of the political spectrum, yet experiences little cognitive dissonance.
[3] Did I just make some enemies? I might live in Washington, DC, but I don’t play politics with math. It’s either right or wrong…sorry, guys.
[4] Unfortunately, data on informal prison networks is not readily available. We know they exist and how they function in many ways—but empirical collection of this data is all but impossible. In English, the best source is the “Gulag Archipelago” by Alexander Solzhenitsin.
[5] Tsvetovat, M. and K. M. Carley. “Structural Knowledge and Success of Anti-Terrorist Activity: The Downside of Structural Equivalence.” Journal of Social Structure (http://www.cmu.edu/joss/) 6 (2005).
[6] You can read about Moldova’s Twitter Revolution online at http://neteffect.foreignpolicy.com/posts/2009/04/07/moldovas_twitter_revolution.
[7] Granovetter, Mark. “Strength Of Weak Ties, A Network Theory Revisited.” Sociological Theory 1 (1983), 201-233.
[8] Hill, R. A. and Dunbar, R.,“Social network size in humans.” Human Nature 14 (2003), 53-72.
[9] DeepMile Networks is a highly specialized management and technology consulting firm that delivers cutting edge solutions to the advertising and national security communities.
[10] An abridged dataset can be downloaded from https://github.com/maksim2042/SNABook/tree/master/chapter1.
Get Social Network Analysis for Startups now with the O’Reilly learning platform.
O’Reilly members experience books, live events, courses curated by job role, and more from O’Reilly and nearly 200 top publishers.

