Name
new( ) — create a new graph object
Synopsis
new GIFgraph::bars(width, height)
new GIFgraph::lines(width, height)
new GIFgraph::points(width, height)
new GIFgraph::linespoints(width, height)
new GIFgraph::area(width, height)
new GIFgraph::pie(width, height)
The new( ) method
creates a new graph object. The width and
height parameters are optional; if they are not
set, the graph is created with a default width of 400 pixels and
height of 300 pixels. GIFgraph implements six different kinds of
graphs:
- GIFgraph::bars
A graph where the data is represented as colored bars (Figure 6.3).
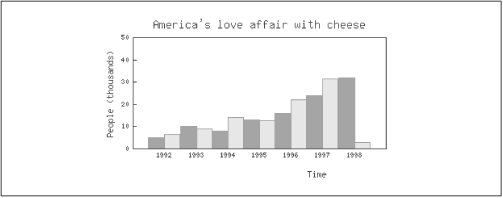
Figure 6-3. A bars graph
- GIFgraph::lines
A graph with lines connecting the data points (Figure 6.4). Use a linespoints graph to plot the data points as well as the lines.
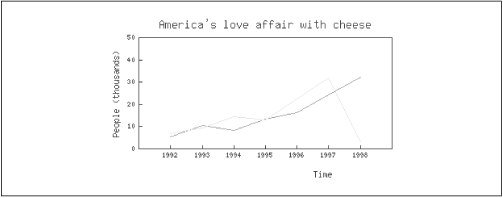
Figure 6-4. A lines graph
- GIFgraph::points
A graph with only the data points plotted (Figure 6.5).
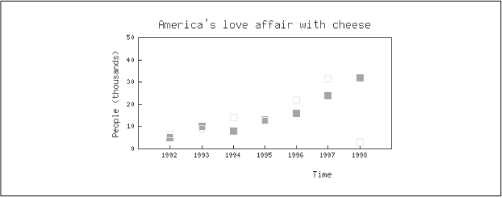
Figure 6-5. A points graph
- GIFgraph::linespoints
A graph with lines connecting visible data points (Figure 6.6).
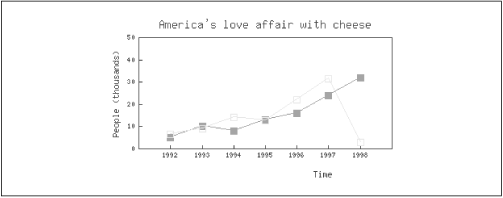
Figure 6-6. A linespoints graph
- GIFgraph::area
A graph with lines connecting the data points and the area under the line filled with a color (
Get Programming Web Graphics with Perl and GNU Softwar now with the O’Reilly learning platform.
O’Reilly members experience books, live events, courses curated by job role, and more from O’Reilly and nearly 200 top publishers.

