IDE Debugging
For more complex debugging issues, you would be best served to use a debugger that can be found in a good IDE (Integrated Development Environment). We will be showing you a debug session example with Zend Studio for Eclipse. Other IDEs, like Komodo and PhpED, have built-in debuggers, so they can also be used for this purpose.
In Zend Studio, there is an entire Debug Perspective set up for debugging purposes. Figure 16-1 shows the default look of this perspective.
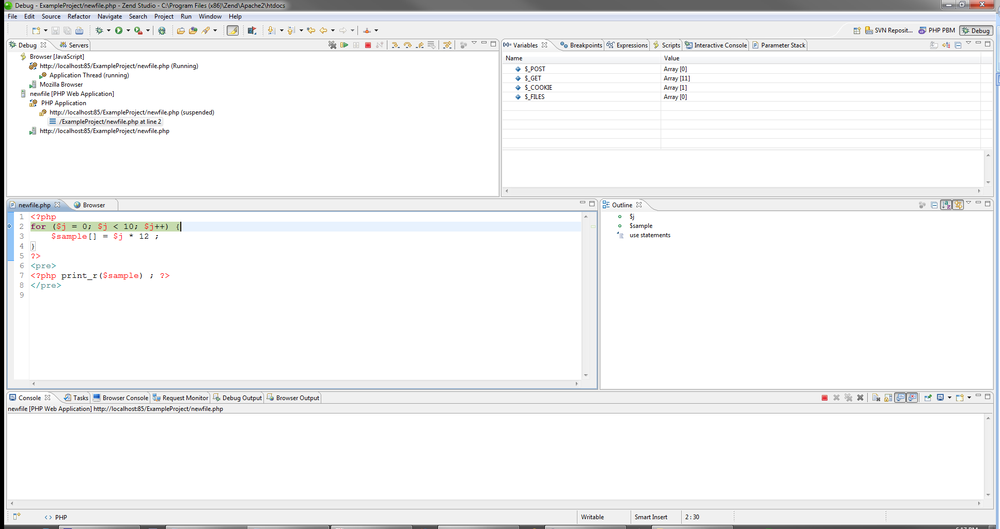
Figure 16-1. The default Debug Perspective in Zend Studio
The menu is the place to start with this debugger to get your bearings. Pull down the Run menu and you will see all the options that you can try when in the debug process. Stepping into and over code segments, running to a cursor location, restarting the session from the beginning, and just simply letting your code run until it fails or ends are just some of the options available.
Note
In Zend Studio for Eclipse you can even debug JavaScript code with the right setup!
Check the many debug views in this product as well; you can see and watch the variables (both superglobals and user-defined) as they change over the course of executing code.
Breakpoints can also be set (and suspended) anywhere in the PHP code, so that you can run to a certain location in your code and see what the overall situation is at that particular moment. Two other very handy views that ...
Get Programming PHP, 3rd Edition now with the O’Reilly learning platform.
O’Reilly members experience books, live events, courses curated by job role, and more from O’Reilly and nearly 200 top publishers.

