Debugging with Flex Builder
One of the best selling points of Flex Builder is the integrated GUI debugger. FDB is free, but for day-to-day debugging, Flex Builder’s debugger makes it much easier to debug applications.
A default Flex Builder installation (see Figure 18-2) will configure the tasks needed to get you up and running for debugging applications. To debug an application you are working on, you just need to select Run→Debug from the main menu (or press F11). This will compile the application if it is not already compiled, launch it within the browser, and connect the application to the debugger. The first time you debug an application you will be prompted to switch perspectives to the debugging perspective in Flex Builder, which usually is recommended.
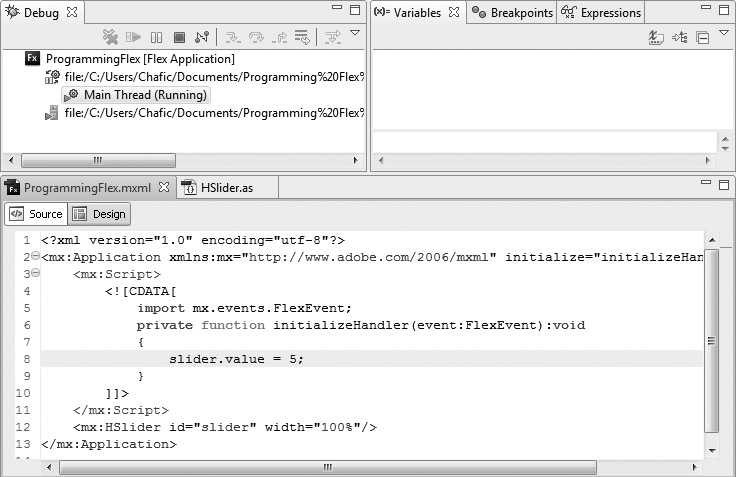
Figure 18-2. Default debugging perspective
When in the debugging perspective, you will have access to the currently running application. Often you will set a breakpoint to stop the application at a point during the execution process in which you are interested. You can set breakpoints by double-clicking the left margin of a source line or by using the keyboard shortcut Ctrl-Shift-B. You can do this during a debug session or even before a session is started in the development perspective. You can navigate through a list of breakpoints by using the Breakpoints panel (see Figure 18-3). The Breakpoints panel contains a list of all ...
Get Programming Flex 3 now with the O’Reilly learning platform.
O’Reilly members experience books, live events, courses curated by job role, and more from O’Reilly and nearly 200 top publishers.

