Create Charts Quickly
Use the Chart object’s ChartWizard method to create charts quickly in code. ChartWizard is a shortcut through the complex chart object model that lets you chart data in two steps:
Create a new
Chartobject in the workbook.Call the
ChartWizardmethod on that object.
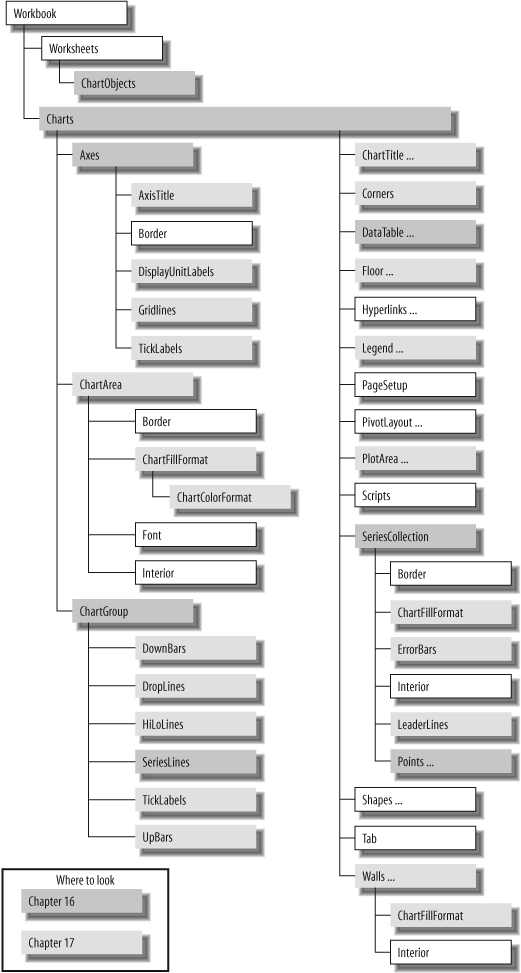
Figure 16-1. Guide to the chart objects
For example, the following code adds a new chart sheet to a workbook, then charts data from the HomeSales named range:
Sub ChartWizard1(  )
    Dim ws As Worksheet, chrt As Chart
    Set ws = ActiveSheet
    ' 1) Create a chart sheet.
    Set chrt = Charts.Add(, ws)
    ' 2) Chart the data.
    chrt.ChartWizard ws.[HomeSales]
End Sub
If you run the preceding sample, you’ll get a 3-D area chart that looks impressive but is almost entirely useless. The chart would make much more sense as a simple line chart, and it would be nice to include a legend and axis labels. To do that, fill out the ChartWizard arguments as shown here:
Sub ChartWizard2(  )
    Dim ws As Worksheet, chrt As Chart
    Set ws = ActiveSheet
    ' Create a chart sheet.
    Set chrt = Charts.Add(, ws)
    ' Name the sheet.
    chrt.Name = "Median FL Prices"
    ' Specify chart type, axis labels, legend, and title.
    chrt.ChartWizard ws.[HomeSales], xlLine, , xlColumns, 1, 1, True, _
      "FL Median Home Prices", "Year", "Price"
End Sub
Figure 16-2 shows the result of ChartWizard2 and labels the parts of the chart with the corresponding ChartWizard arguments.
Get Programming Excel with VBA and .NET now with the O’Reilly learning platform.
O’Reilly members experience books, live events, courses curated by job role, and more from O’Reilly and nearly 200 top publishers.

