Chapter 40. Debugging with Breakpoints
WHAT'S IN THIS CHAPTER?
Using breakpoints, conditional breakpoints, and tracepoints to pause code execution
Controlling the program execution during debug by stepping through code
Modifying your code while it is running using the Edit and Continue feature
Long gone are the days where debugging an application involved adding superfluous output statements to track down where an application was failing. Visual Studio 2010 provides a rich interactive debugging experience that includes breakpoints, tracepoints, and the Edit and Continue feature. This chapter covers how you can use these features to debug your application.
BREAKPOINTS
A breakpoint is used to pause, or break, an application at a particular point of execution. An application that has been paused is said to be in Break mode, causing a number of the Visual Studio 2010 windows to become active. For example, the Watch window can be used to view variable values. Figure 40-1 shows a breakpoint that has been added to the constructor of the Customer class. The application breaks on this line if the Customer class constructor is called.
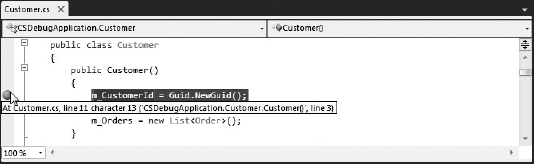
Figure 40-1. Figure 40-1
Setting a Breakpoint
Breakpoints can be set either through the Debug menu, using the Breakpoint item from the right-click context menu, or by using the keyboard shortcut, F9. The Visual Studio 2010 code editor also provides a shortcut for setting ...
Get Professional Visual Studio® 2010 now with the O’Reilly learning platform.
O’Reilly members experience books, live events, courses curated by job role, and more from O’Reilly and nearly 200 top publishers.

