Debugging JavaScript
Because HTML5 games are heavy on JavaScript, you’ll often want to inspect your running game when stuff goes wrong or behaves unexpectedly. Luckily, Developer Tools provides a debugging environment that is second to none, allowing you to look at the objects, functions, and values as well as stop your game’s execution at a specific point and look at the exact state of the game.
Examining the Console Tab
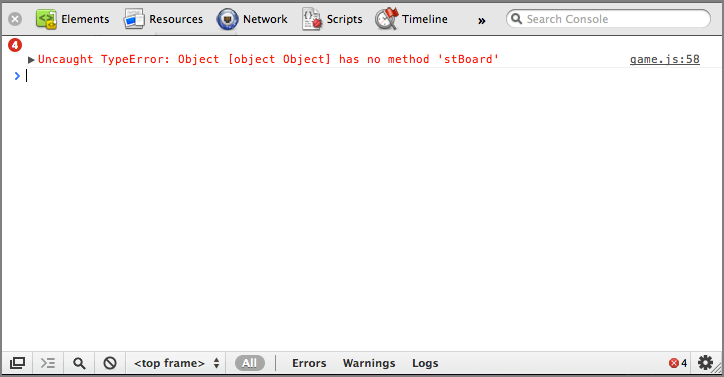
Your first stop when something goes wrong should be the Console tab. It alerts you to any JavaScript errors that have occurred while running your game. Errors are highlighted in red, and you get a filename and line number where the error occurred (see Figure 7-8).
Figure 7-8: A JavaScript error in the console.
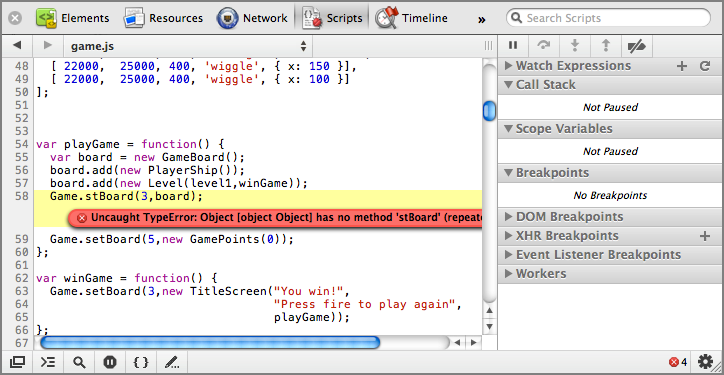
Clicking the filename on the right takes you to the file where the problem occurred and with the offending line highlighted (see Figure 7-9). You can click the little arrow to the left of the error to open the callback, which shows you all the nested function calls needed to get to the current line.
Figure 7-9: A JavaScript error at the spot of the error.
In addition to highlighting errors, you can also use the console.log method to log messages and data to the console. If you log a string it shows up as a string in the console with a matching line number ...
Get Professional HTML5 Mobile Game Development now with the O’Reilly learning platform.
O’Reilly members experience books, live events, courses curated by job role, and more from O’Reilly and nearly 200 top publishers.

