PORTFOLIOS IN PRACTICE—EXAMPLE OF MARKETWATCH.COM’S LAZY PORTFOLIOS
The last section described in theory how we might analyze portfolios, but how does this work in practice? To illustrate how an investor might analyze a portfolio ex ante, let’s examine three simple portfolios as described on Paul B. Farrell’s MarketWatch.com web site. Farrell labels them Lazy Portfolios because they can be implemented easily using index funds.14 The three portfolios chosen are the three simplest of his eight portfolios. They are labeled A through C in Table 8.4, but on his web site they have the colorful names Margaritaville, Dr. Bernstein’s No Brainer, and Second Grader’s Starter.15 The portfolios range from conservative to aggressive with investment in bonds ranging from 33 percent, 25 percent, to 10 percent, respectively. The portfolio returns are estimated by using the premium estimates reported in Tables 8.2 and 8.3. The standard deviations are measured over the 20-year period from 1990 through 2009.16
TABLE 8.4 MarketWatch.com Portfolios Compared
Data Sources: ©Morningstar, S&P, MSCI, Barclays Capital, and RussellR®.
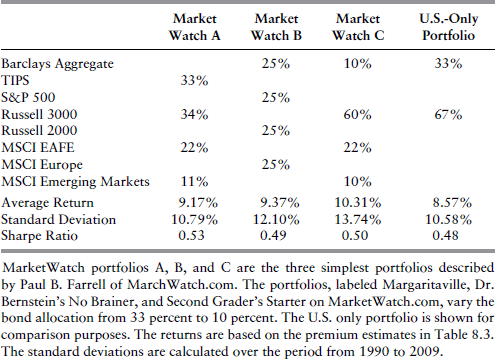
Table 8.4 analyzes the three MarketWatch.com portfolios as well as a simple U.S.-only bond/stock portfolio. The table reports the proportion invested in each asset as well as the returns and standard deviations of each portfolio. Portfolio A has 33 percent invested in bonds, while ...
Get Portfolio Design: A Modern Approach to Asset Allocation now with the O’Reilly learning platform.
O’Reilly members experience books, live events, courses curated by job role, and more from O’Reilly and nearly 200 top publishers.

