RETURNS ON U.S. BONDS
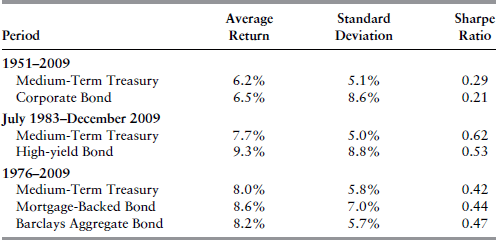
The natural question to ask is: how well have non-Treasury bonds performed over time? Table 7.2 provides an analysis. Since bond returns begin at different times, each series is compared with the five-year medium term Treasury bond over a common period. In Table 7.2, there are three periods studied, each corresponding to the period over which a bond series is available:
TABLE 7.2 Comparisons between Medium-Term U.S. Treasuries and Other Bonds
Data Sources: ©Morningstar for Medium-Term Treasuries and Corporate Bonds. Barclays Capital for the High-Yield and Aggregate Indexes and Merrill Lynch for the Mortgage-Backed Bond Index.

1951–2009: Corporate Bond Index from Morningstar
1983–2009: Barclays Capital High Yield Bond Index
1976–2009: Barclays Capital Aggregate Bond Index and Merrill Lynch Mortgage-backed Bond Index
As shown in Table 7.2, non-Treasury bonds generally provide higher returns than Treasury bonds, at least over the long periods studied in the table. But risks (as measured by standard deviations) are also higher for these bonds. The last column of the table reports the Sharpe ratio for each series. The Sharpe ratios for corporate bonds and high-yield bonds are lower than that of the medium-term Treasury bond, while the Sharpe ratio for mortgage-backed bonds is a little higher.8
Bonds should also be evaluated in a portfolio setting just like any ...
Get Portfolio Design: A Modern Approach to Asset Allocation now with the O’Reilly learning platform.
O’Reilly members experience books, live events, courses curated by job role, and more from O’Reilly and nearly 200 top publishers.

