Attributes of GD::Graph Objects
GD::Graph has several attributes that you can set to control the
layout, color, and labels on your graph. Some of these attributes are
applicable only to certain types of graphs; for example, the pie_height attribute should be set only for
graphs of type GD::Graph::pie. These attributes are relegated to their
own sections later in this chapter. The following section describes
the attributes shared by all graphs.
Attributes of All Graphs
b_margin=>integert_margin=>integerl_margin=>integerr_margin=>integerThese attributes allow you to set the bottom, top, left, and right margins, respectively. The margin is defined as the blank space between the bounding box of the graph and the edge of the PNG graphic. The default margins are 0 pixels.
width=>integerheight=>integerThe dimensions of the final image, including margins.
transparent=>booleanIf the
transparentattribute is set to true, the background color (set with thebgclrattribute) is marked as transparent. The default value is true.interlaced=>booleanThe
interlacedattribute allows you to indicate whether the graph is stored as an interlaced PNG. The default value is true.bgclr=>colornamefgclr=>colornameboxcolor=>colornametextclr=>colornamelabelclr=>colornameaxislabelclr=>colornamelegendclr=>colornamevaluesclr=>colornameaccentclr=>colornameshadowclr=>colornameThese attributes set the colors of the various aspects of the graph: the background, foreground, graph box, text, label, axis label, legend, value label, accent, and shadow colors, respectively. The colorname should be a valid GD::Graph color name (see the upcoming section Colors and Fonts in GD::Graph).
dclrs=>\@colornamesThe
dclrs(data colors) attribute controls the colors for the bars, lines, markers, or pie slices. The attribute should be given a reference to an array containing the desired set of color names. The first line/point/bar/slice is the color of the first element in the array, the second is the color of the second element, and so on. For example, if you setdclrsto the following array of color names:$graph->set(dclrs => ['green', 'red', 'blue')]);
the first data set is green, the second is red, the third is blue, the fourth is green, the fifth red, and so on. That is, if you have more data sets than colors, colors are reused in order.
The default value is:
'lred', 'lgreen', 'lblue', 'lyellow', 'lpurple', 'cyan', 'lorange'
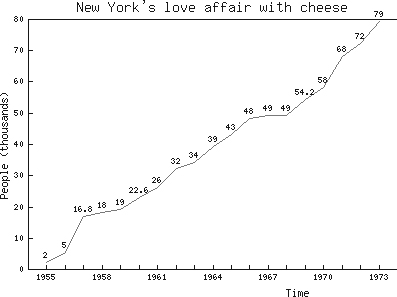
show_values=>boolean | array_refSet this attribute to a true value to draw the data value above each plotted data point. For greater control of the individual labels, you can assign this a reference to a data set, which is used for the corresponding value labels. Note that you may need to manually adjust the dimensions of the image to accommodate all data value labels. For example, set this attribute with some of the data at the beginning of this chapter:
$graph->set(show_values => 1 );
to produce the graph in Figure 4-6.
values_vertical=>booleanIf the
show_valuesattribute is true, this attribute indicates whether the labels should be drawn vertically rather than horizontally. The default is 0 (horizontal).values_space=>integerIf the
show_valuesattribute is true, this attribute specifies the amount of vertical space between the data point and the value label. The default value is 4 pixels.values_format=>string | func_refIf the
show_valuesattribute is true, this attribute specifies a formatting template that should be used when drawing the value label. The template can be defined as asprintf-style template string, or as a reference to a function that returns a properly formatted string given a data value.
Attributes of Graphs with Axes
box_axis=>booleanIf this attribute is true, the axes are drawn as a box rather than as two lines. The default is true.
two_axes=>booleanIf you have two data sets that you wish to plot against two axes on the same graph, you can set the
two_axesattribute to a true value—the first data set is plotted against an axis to the left and the second set is plotted against the axis to the right. The default value is 0.zero_axis=>booleanzero_axis_only=>booleanIf
zero_axisis set to true, an axis is always drawn at the y=0 line. Ifzero_axis_onlyis true, the zero axis is the only axis that is drawn, and all x-axis values are plotted on this axis. If both attributes are 0, all x values are plotted along the bottom border of the graph. The default value for both attributes is true.x_plot_values=>booleany_plot_values=>booleanIf either of these attributes is set to 0, the values on the given axis are not printed. The tick marks are still plotted. The default value is true.
y_max_value=>float,y1_max_value=>float,y2_max_value=>floaty_min_value=>float,y1_min_value=>float,y2_min_value=>floatThese values control the maximum and minimum values to be plotted on the y axis of a graph. Setting a value of
y_min_valuethat is greater than the smallest value in the data set, or a value ofy_max_valuethat is less than the greatest value within the data set, results in an error. For bar and area graphs, the range of points defined by these attributes must include 0. If it does not, the values are extended to include 0.When plotting two data sets on two separate axes, use
y1_min_valueandy1_max_valueto define the range of the left axis, andy2_min_valueandy2_max_valueto define the range of the right axis.The default values are the minimum and maximum values of the data sets.
x_tick_number=>integerThis attribute controls the number of ticks displayed on the x axis. By default, GD::Graph attempts to guess the optimal number of ticks based on the data. If
undef, one tick is displayed for each data point.x_min_value=>floatx_max_value=>floatNormally, the maximum values of the x axis are calculated from the data. This attribute allows you to set arbitrary maximum and minimum values.
y_number_format=>stringThis attribute specifies a formatting template that should be used when drawing the labels on the respective axis. The template can be defined as a
sprintf-style template string, or as a reference to a function that returns a properly formatted string given a data value.x_label_skip=>integery_label_skip=>integerx_tick_offset=>integerx_all_ticks=>booleanIf
x_label_skipis set to an integer greater than 1, then only those ticks numbered as multiples ofx_label_skipare labeled on the graph. (A tick is the position where a value is labeled on an axis.) For example, a value of 2 causes every second tick to be labeled, 5 means every fifth should be labeled, etc. The same holds true fory_label_skip. The default value for both attributes is 1. Use thex_tick_offsetattribute to specify the first x value that should be displayed. Ifx_all_ticksis true, a tick is drawn for every x value, regardless of whether the label is drawn.x_label_position=>floatThis attribute controls how the individual labels are aligned to the tick on the x axis. The value is a fraction that indicates the point on the width of the label that should be aligned with the tick. If
x_label_positionis 0, the left margin of the label is aligned at the tick; a value of .5 means that the label is centered, and 1 means that it is right-aligned. The default value is .75.y_label_position=>floatThis attribute controls how the individual labels are aligned to the tick on the y axis. The behavior is similar to that of
x_label_position, except that if the value is 0 the label is bottom-aligned, and if it is 1 the label is top-aligned. The default value is .5.x_labels_vertical=>booleanIf true, the labels on the x axis are drawn vertically. The default is 0.
long_ticks=>booleantick_length=>integerIf the
long_ticksattribute is true, the graph’s ticks are all the same length as the axes, creating a grid across the graph. Iflong_ticksis 0, the ticks are as many pixels long as the value of theticks_lengthattribute. The default value oflong_ticksis 0, and oftick_lengthis 4.x_ticks=>booleanIf
x_ticksis set to 0, the ticks on the x axis will not be drawn. The default value is true.y_tick_number=>integerThis attribute controls the number of ticks to be plotted on the y axis. Thus, the increment between ticks is (
y_max_value−y_min_value) /y_ticks_number. The default value is 5.axis_space=>integerThis attribute controls the amount of space (in pixels) to be left between each axis and its corresponding text. The default value is 4 pixels.
text_space=>integerThis attribute indicates the amount of space that should be left between the axis and any textual labels related to that axis. The default value is 8 pixels.
Attributes of Bar Graphs
correct_width=>booleanIf this attribute is true, the width of the graph is adjusted so that each data point is drawn using an integral number of pixels. This is set to true by default.
overwrite=>{0..2}The
overwriteattribute controls the appearance of bar graphs with multiple data sets. The attribute may be set to one of the following values:0Bars of different data sets are drawn next to each other. (This is the default.)
1Bars of different data sets are drawn in front of each other.
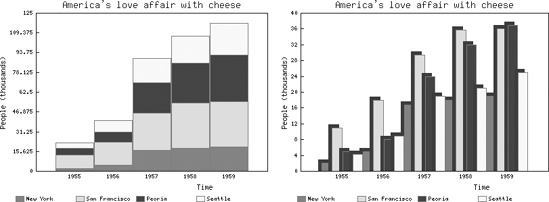
2Bars of different data sets are drawn on top of each other (to show a cumulative effect). See Figure 4-7, left.
bar_width=>integerBy default, the
bar_spacingattribute and the dimensions of the graph are used to determine the width of each bar. If you want to specify a fixed size for the bars, use this attribute.bar_spacing=>integerThis attribute sets the amount of space between bars. The default value is 0. Note that this attribute is ignored if the
bar_widthattribute is defined.shadow_depth=>integerUse this attribute to specify the direction and size of the shadow cast by each bar. Positive values indicate shadows to the right and down; negative values produce a shadow to the left and up. The default value is 0 (no shadow). See Figure 4-7, right.
borderclrs=>integerThis is a reference to a list of colors (like
dclrs) that should be used to draw the “stroke” of the bar. One color should be specified for each data set.cycle_clrs=>booleanNormally, all the bars of a given data set are drawn in the same color, which is determined by the list of colors in the
dclrslist. If thecycle_clrsattribute is true, the bar for each data point (rather than for each data set) is drawn in the next color in thedclrslist.cumulate=>booleanIf this attribute is true, bars of different data sets are drawn stacked on top of each other vertically (see also the
overwriteattribute). This attribute also applies to area graphs.
Attributes of Graphs with Lines
line_types=>\@typelistThis attribute lets you specify the styles of lines with which each data set should be plotted on the graph. The list of line types is a reference to an array of integers. The default value is
[1], which means that all data sets are plotted as solid lines. You can choose from the following types:line_type_scale=>integerThis attribute controls the length of the dashes in the dashed line types. The default value is 6 pixels.
line_width=>integerThis attribute controls the width of the lines in the graph. The default value is 1 pixel.
skip_undef=>booleanIn graphs with lines, undefined points are not plotted. However, by default a line is still drawn between the two points surrounding the undefined value, thus “implying” a value at that point. If
skip_undefis true, this line is not drawn and a gap is left between the two points surrounding the undefined point.
Attributes of Graphs with Points
markers=>\@markerlistThe
markersattribute controls the order and styling of the point markers used to plot points in graphs of type points or linespoints. The attribute is set with a reference to an array of integers that correspond to the following marker types:1Filled square
2Open square
3Horizontal cross
4Diagonal cross
5Filled diamond
6Open diamond
7Filled circle
8Open circle
The default value is
[1,2,3,4,5,6,7,8], which means that the first set of data points is plotted with filled squares, the second with open squares, and so on.
marker_size=>integerThis attribute controls the size of the point markers. The default is 4 pixels.
Attributes of Mixed Graphs
types=>\@typesThis attribute is a reference to a list of strings that describe the types of graphs that should be drawn for each data set. Acceptable values are
area,bars,lines,linespoints, andpoints. Data sets that do not have a corresponding value in this list or that have an undefined value are plotted using the default type as defined by thedefault_typeattribute.default_type=>stringThe default graph type for data sets whose types are not specified by the
typesattribute. The default type isarea.
Attributes of Pie Graphs
3d=>booleanIf the
3dattribute of a pie graph is set to true, it is drawn with a 3D look. The “thickness” of the pie chart is taken from thepie_heightattribute. The default value of3dis true.pie_height=>floatThis attribute sets the height of the graph if it is a 3D pie graph (i.e., if
3dis true). The default value forpie_heightis 10% of the height of the total image.start_angle=>degreesThis attribute gives the angle at which the first slice of a pie chart is plotted. The default starting angle is 0 degrees, which corresponds to 6 o’clock.
suppress_angle=>degreesIf a true value, pie slices with an angle less than this value are not labeled. The default value is 0, which means that labels are drawn.
Logos and Legends
logo=>filenamelogo_position=>position_codelogo_resize=>scalefactorYou may associate a logo (a separate PNG file) for inclusion in the corner of a graph. This logo can be positioned and resized within the graph by setting the
logo_positionandlogo_resizeattributes. The value ofposition_codeindicates one of the four corners of the graph withLL,LR,UL, orURcorresponding to the lower/upper left/right corners. The default position isLR(lower right corner). Thelogo_resizeattribute should be expressed in multiples of the original logo size (i.e., 2 for 200%, .5 for 50%). For example, the following lines take the file mylogo.png, shrink it by 50%, and include it in the upper right corner of a previously defined graph named$graph:$graph->set(logo => 'mylogo.png', logo_resize => .5, logo_position => 'UR', legend_placement=>'BL' );legend_placement=>{ 'BL','BC', 'BR', 'RT', 'RC', or 'RB'}This attribute controls placement of the legend within the graph image. The value is supplied as a two-letter string, where the first letter is placement (a
Bor anRfor bottom or right, respectively) and the second is alignment (L,R,C,T, orBfor left, right, center, top, or bottom, respectively). The default value isBCfor center-aligned on the bottom of the graph. The legend is automatically wrapped, depending on its placement.legend_spacing=>integerThis attribute specifies the number of pixels in the blank margin around the legend. The default value is 4 pixels.
legend_marker_width=>integerlegend_marker_height=>integerThese attributes control the height and width of a legend marker in pixels. The default values are
width=12 andheight=8.lg_cols=>integerThis attribute allows you to force a legend at the bottom of a graph into a specified number of columns. The default value is intelligently computed when the legend is plotted.
Get Perl Graphics Programming now with the O’Reilly learning platform.
O’Reilly members experience books, live events, courses curated by job role, and more from O’Reilly and nearly 200 top publishers.

