Oracle Performance Manager
A component of Oracle Enterprise Manager (OEM), referred to as the Oracle Performance Manager, allows you to monitor Oracle Parallel Server. Using this monitoring tool, you can graphically view several OPS statistics through charts and graphs. You can drill down from some charts to get further detailed statistics. This provides a convenient way to monitor key OPS performance statistics. Refer to the Oracle Enterprise Manager Configuration Guide for information on how to set up Oracle Performance Manager for your Oracle Parallel Server environment. Figure 10.3 shows the available charts for Oracle Parallel Server.
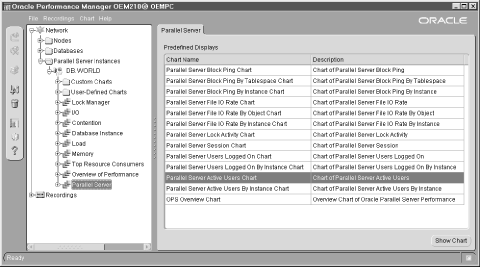
Figure 10-3. Many OPS performance charts are available in Oracle Performance Manager
The graphical views provided by this tool are based on data from dynamic performance views such as V$PING and V$LOCK_ACTIVITY. For example, Figure 10.4 shows the Parallel Server Block Ping by Tablespace Chart. This view shows statistics from the V$PING view and shows the number of blocks pinged for each tablespace by a given OPS database instance. From this graph, you can drill down to get object-level ping information. You can either use the drilldown menu or right-click a specific tablespace and select one of the drilldown options from the fly-out menu.
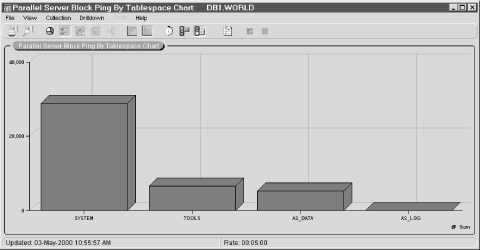
Figure 10-4. Parallel ...
Get Oracle Parallel Processing now with the O’Reilly learning platform.
O’Reilly members experience books, live events, courses curated by job role, and more from O’Reilly and nearly 200 top publishers.

