Chapter 1. A Better Way to Optimize
For many people, Oracle performance is a very difficult problem. Since 1990, I’ve worked with thousands of professionals engaged in performance improvement projects for their Oracle systems. Oracle performance improvement projects appear to progress through standard stages over time. I think the names of those stages are stored in a vault somewhere beneath Geneva. If I remember correctly, the stages are:
| Unrestrained optimism |
| Informed pessimism |
| Panic |
| Denial |
| Despair |
| Utter despair |
| Misery and famine |
For some reason, my colleagues and I are rarely invited to participate in a project until the “misery and famine” stage. Here is what performance improvement projects often look like by the time we arrive. Do they sound like situations you’ve seen before?
- Technical experts disagree over root causes
The severity of a performance problem is proportional to the number of people who show up at meetings to talk about it. It’s a particularly bad sign when several different companies’ “best experts” show up in the same meeting. In dozens of meetings throughout my career, I’ve seen the “best experts” from various consulting companies, computer and storage subsystem manufacturers, software vendors, and network providers convene to dismantle a performance problem. In exactly 100% of these meetings I’ve attended, these groups have argued incessantly over the identity of a performance problem’s root cause. For weeks. How can dedicated, smart, well-trained, and well-intentioned professionals all look at the same system and render different opinions—often even contradictory opinions—on what’s causing a performance problem? Apparently, Oracle system performance is a very difficult problem.
- Experts claim excellent progress, while users see no improvement
Many of my students grin with memories when I tell stories of consultants who announce proudly that they have increased some statistic markedly—maybe they increased some hit ratio or reduced some extent count or some such—only to be confronted with the indignity that the users can’t tell that anything is any better at all. The usual result of such an experience is a long report from the consultant explaining as politely as possible that, although the users aren’t clever enough to tell, the system is eminently better off as a result of the attached invoice.
The story is funny unless, of course, you’re either the owner of a company who’s paying for all this wasted time, or the consultant who won’t get paid because he didn’t actually accomplish anything meaningful. Maybe this story seems funny because most of us at some time or another have been that consultant. How is it possible to so obviously improve such important system metrics as hit ratios, average latencies, and wait times, yet have users who can’t even perceive the beneficial results of our effort? Apparently, Oracle system performance is a very difficult problem.
- Hardware upgrades either don’t help, or they slow the system further
Since first picking up Neil Gunther’s The Practical Performance Analyst in 1998 [Gunther (1998)], I have presented to various audiences the possibility of one particularly counterintuitive phenomenon. “Do you realize that a hardware upgrade can actually degrade the performance of an important application?” Every audience to which I’ve ever presented this question and the facts pertaining to it have had virtually identical reactions. Most of the audience smiles in disbelief while I describe how this can happen, and one or two audience members come to the podium afterward to rejoice in finally figuring out what had happened several months after their horrible “upgrade gone wrong.”
Hardware upgrades may not often cause noticeable new performance problems, but they can. Very often, hardware upgrades result in no noticeable difference, except of course for the quite noticeable amount of cash that flows out the door in return for no perceptible benefit. That a hardware upgrade can result in no improvement is somewhat disturbing. The idea that a hardware upgrade can actually result in a performance degradation, on its face, is utterly incomprehensible. How is it possible that a hardware upgrade might not only not improve performance, but that it might actually harm it? Apparently, Oracle system performance is a very difficult problem.
- The number one system resource consumer is waste
Almost without exception, my colleagues and I find that 50% or more of every system’s workload is waste. We define “waste” very carefully as any system workload that could have been avoided with no loss of function to the business. How can completely unnecessary workload be the number one resource consumer on so many professionally managed systems? Apparently, Oracle system performance is a very difficult problem.
These are smart people. How could their projects be so messed up? Apparently, Oracle system optimization is very difficult. How else can you explain why so many projects at so many companies that don’t talk to each other end up in horrible predicaments that are so similar?
“You’re Doing It Wrong”
One of my hobbies involves building rather largish things out of wood. This hobby involves the use of heavy machines that, given the choice, would prefer to eat my fingers instead of a piece of five-quarters American Black Walnut. One of the most fun things about the hobby for me is to read about a new technique that improves accuracy and saves time, while dramatically reducing my personal risk of accidental death and dismemberment. For me, getting the “D’oh, I’m doing it wrong!” sensation is a pleasurable thing, because it means that I’m on the brink of learning something that will make my life noticeably better. The net effect of such events on my emotional well-being is overwhelmingly positive. Although I’m of course a little disappointed every time I acquire more proof that I’m not omniscient, I’m overjoyed at the notion that soon I’ll be better.
It is in the spirit of this story that I submit for your consideration the following hypothesis:
If you find that Oracle performance tuning is really difficult, then chances are excellent that you’re doing it wrong.
Now, here’s the scary part:
You’re doing it wrong because you’ve been taught to do it that way.
This is my gauntlet. I believe that most of the Oracle tuning methods either implied or taught since the 1980s are fundamentally flawed. My motivation for writing this book is to share with you the research that has convinced me that there’s a vastly better way.
Let’s begin with a synopsis of the “method” that you’re probably using today. A method is supposed to be a deterministic sequence of steps. One of the first things you might notice in the literature available today is the striking absence of actual method. Most authors focus far more attention on tips and techniques than on methods. The result is a massive battery of “things you might want to do” with virtually no structure present to tell you whether or when it’s appropriate to do each. If you browse google.com hits on the string “Oracle performance method,” you’ll see what I mean.
Most of the Oracle performance improvement methods prescribed today can be summarized as the sequence of steps described in Method C (the conventional trial-and-error approach). If you have a difficult time with Oracle performance optimization, the reason may dawn on you as you review Method C. One of the few things that this method actually optimizes is the flow of revenue to performance specialists who take a long time to solve performance problems.
This trial-and-error approach is, of course, not the only performance improvement method in town. The YAPP Method first described by Anjo Kolk and Shari Yamaguchi in the 1990s [Kolk et al. (1999)] was probably the first to rise above the inauspicious domain of tips and techniques to result in a truly usable deterministic sequence of steps. YAPP truly revolutionized the process of performance problem diagnosis, and it serves as one of the principal inspirations for this text.
Requirements of a Good Method
What distinguishes a good method from a bad one? When we started hotsos.com in 1999, I began spending a lot of time identifying the inefficiencies of existing Oracle performance improvement methods. It was a fun exercise. After much study, my colleagues and I were able to construct a list of objectively measurable criteria that would assist in distinguishing good from bad in a method. We hoped that such a list would serve as a yardstick that would allow us to measure the effectiveness of any method refinements we would create. Here is the list of attributes that I believe distinguish good methods from bad ones:
- Impact
If it is possible to improve performance, a method must deliver that improvement. It is unacceptable for a performance remedy to require significant investment input but produce imperceptible or negative end-user impact.
- Efficiency
A method must always deliver performance improvement results with the least possible economic sacrifice. A performance improvement method is not optimal if another method could have achieved a suitable result less expensively in equal or less time.
- Measurability
A method must produce performance improvement results that can be measured in units that make sense to the business. Performance improvement measurements are inadequate if they can be expressed only in technical units that do not correspond directly to improvement in cash flow, net profit, and return on investment.
- Predictive capacity
A method must enable the analyst to predict the impact of a proposed remedy action. The unit of measure for the prediction must be the same as that which the business will use to measure performance improvement.
- Reliability
A method must identify the correct root cause of the problem, no matter what that root cause may be.
- Determinism
A method must guide the analyst through an unambiguous sequence of steps that always rely upon documented axioms, not experience or intuition. It is unacceptable for two analysts using the same method to draw different conclusions about the root cause of a performance problem.
- Finiteness
A method must have a well-defined terminating condition, such as a proof of optimality.
- Practicality
A method must be usable in any reasonable operating condition. For example, it is unacceptable for a performance improvement method to rely upon tools that exist in some operating environments but not others.
Method C suffers brutally on every single dimension of this eight-point definition of “goodness.” I won’t belabor the point here, but I do encourage you to consider, right now, how your existing performance improvement methods score on each of the attributes listed here. You might find the analysis quite motivating. When you’ve finished reading Part I of this book, I hope you will revisit this list and see whether you think your scores have improved as a result of what you have read.
Three Important Advances
In the Preface, I began with the statement:
Optimizing Oracle response time is, for the most part, a solved problem.
This statement stands in stark contrast to the gloomy picture I painted at the beginning of this chapter—that, “For many people, Oracle system performance is a very difficult problem.” The contrast, of course, has a logical explanation. It is this:
Several technological advances have added impact, efficiency, measurability, predictive capacity, reliability, determinism, finiteness, and practicality to the science of Oracle performance optimization.
In particular, I believe that three important advances are primarily responsible for the improvements we have today. Curiously, while these advances are new to most professionals who work with Oracle products, none of these advances is really “new.” Each is used extensively by optimization analysts in non-Oracle fields; some have been in use for over a century.
User Action Focus
The first important advance in Oracle optimization technology follows from a simple mathematical observation:
You can’t extrapolate detail from an aggregate.
Here’s a puzzle to demonstrate my point. Imagine that I told you that a collection of 1,000 rocks contains 999 grey rocks and one special rock that’s been painted bright red. The collection weighs 1,000 pounds. Now, answer the following question: “How much does the red rock weigh?” If your answer is, “I know that the red rock weighs one pound,” then, whether you realize it or not, you’ve told a lie. You don’t know that the red rock weighs one pound. With the information you’ve been given, you can’t know. If your answer is, “I assume that the red rock weighs one pound,” then you’re too generous in what you’re willing to assume. Such an assumption puts you at risk of forming conclusions that are incorrect—perhaps even stunningly incorrect.
The correct answer is that the red rock can weigh virtually any amount between zero and 1,000 pounds. The only thing limiting the low end of the weight is the definition of how many atoms must be present in order for a thing to be called a rock. Once we define how small a rock can be, then we’ve defined the high end of our answer. It is 1,000 pounds minus the weight of 999 of the smallest possible rocks. The red rock can weigh virtually anything between zero and a thousand pounds. Answering with any more precision is wrong unless you happen to be very lucky. But being very lucky at games like this is a skill that can be neither learned nor taught, nor repeated with acceptable reliability.
This is one reason why Oracle analysts find it so frustrating
to diagnose performance problems armed only with system-wide
statistics such as those produced by Statspack
(or any of its cousins derived from the old SQL scripts called
bstat and estat). Two
analysts looking at exactly the same Statspack
output can “see” two completely different things, neither of which
is completely provable or completely disprovable by the
Statspack output. It’s not
Statspack’s fault. It’s a problem that is
inherent in any performance analysis that uses
system-wide data as its starting point
(V$SYSSTAT, V$SYSTEM_EVENT, and so on). You can in
fact instruct Statspack to collect sufficiently
granular data for you, but no Statspack
documentation of which I’m aware makes any effort to tell you why
you might ever want to.
A fine illustration is the case of an Oracle system whose red
rock was a payroll processing problem. The officers of the company
described a performance problem with Oracle Payroll that was hurting
their business. The database administrators of the company described
a performance problem with latches: cache buffers
chains latches, to be specific. Both arguments were
compelling. The business truly was suffering from a problem with
payroll being too slow. You could see it, because checks weren’t
coming out of the system fast enough. The “system” truly was
suffering from latch contention problems. You could see it, because
queries of V$SYSTEM_EVENT clearly
showed that the system was spending a lot of time waiting for the
event called latch
free.
The company’s database and system administration staff had
invested three frustrating months trying to fix the “latch free
problem,” but the company had found no relief for the payroll
performance problem. The reason was simple: payroll wasn’t spending
time waiting for latches. How did we find out? We acquired
operational timing data for one execution of the slow payroll
program. What we found was amazing. Yes, lots of other application
programs in fact spent time waiting to acquire cache buffers chains
latches. But of the slow payroll program’s total 1,985.40-second
execution time, only 23.69 seconds were consumed waiting on latches.
That’s 1.2% of the program’s total response time. Had the company
completely eradicated waits for latch free from the face of their system,
they would have made only a 1.2% performance improvement in the
response time of their payroll program.
How could system-wide statistics have been so misleading? Yes,
lots of non-payroll workload was prominently afflicted by latch free problems. But it was a grave
error to assume that the payroll program’s problem was the same as
the system-wide average problem. The error in assuming a
cause-effect relationship between latch
free waiting and payroll performance cost the company
three months of wasted time and frustration and thousands of dollars
in labor and equipment upgrade costs. By contrast, diagnosing the
real payroll performance problem consumed only about ten minutes of
diagnosis time once the company saw the correct diagnostic
data.
My colleagues and I encounter this type of problem repeatedly. The solution is for you (the performance analyst) to focus entirely upon the user actions that need optimizing. The business can tell you what the most important user actions are. The system cannot. Once you have identified a user action that requires optimization, then your first job is to collect operational data exactly for that user action—no more, and no less.
Response Time Focus
For a couple of decades now, Oracle performance analysts have labored under the assumption that there’s really no objective way to measure Oracle response time [Ault and Brinson (2000), 27]. In the perceived absence of objective ways to measure response time, analysts have settled for the next-best thing: event counts. And of course from event counts come ratios. And from ratios come all sorts of arguments about which “tuning” actions are important, and which ones are not.
However, users don’t care about event counts and ratios and arguments; they care about response time: the duration that begins when they request something and ends when they get their answer. No matter how much complexity you build atop any timing-free event-count data, you are fundamentally doomed by the following inescapable truth, the subject of the second important advance:
You can’t tell how long something took by counting how many times it happened.
Users care only about response times. If you’re measuring only event counts, then you’re not measuring what the users care about. If you liked the red rock quiz, here’s another one for you: What’s causing the performance problem in the program that produced the data in Example 1-1?
Response Time Component # Calls ------------------------------ --------- CPU service 18,750 SQL*Net message to client 6,094 SQL*Net message from client 6,094 db file sequential read 1,740 log file sync 681 SQL*Net more data to client 108 SQL*Net more data from client 71 db file scattered read 34 direct path read 5 free buffer waits 4 log buffer space 2 direct path write 2 log file switch completion 1 latch free 1
Example 1-2 shows the same data from the same program execution, this time augmented with timing data (reported in seconds) and sorted by descending response time impact. Does it change your answer?
Response Time Component Duration # Calls Dur/Call
----------------------------- ----------------- -------------- ------------
SQL*Net message from client 166.6s 91.7% 6,094 0.027338s
CPU service 9.7s 5.3% 18,750 0.000515s
unaccounted-for 2.2s 1.2%
db file sequential read 1.6s 0.9% 1,740 0.000914s
log file sync 1.1s 0.6% 681 0.001645s
SQL*Net more data from client 0.3s 0.1% 71 0.003521s
SQL*Net more data to client 0.1s 0.1% 108 0.001019s
free buffer waits 0.1s 0.0% 4 0.022500s
SQL*Net message to client 0.0s 0.0% 6,094 0.000007s
db file scattered read 0.0s 0.0% 34 0.001176s
log file switch completion 0.0s 0.0% 1 0.030000s
log buffer space 0.0s 0.0% 2 0.005000s
latch free 0.0s 0.0% 1 0.010000s
direct path read 0.0s 0.0% 5 0.000000s
direct path write 0.0s 0.0% 2 0.000000s
----------------------------- ----------------- -------------- ------------
Total 181.8s 100.0%Of course it changes your answer, because response time is
dominatingly important, and event counts are inconsequential by
comparison. The problem with the program that generated this data is
what’s going on with SQL*Net message from
client, not what’s going on with CPU service.
Tip
If you are an experienced Oracle performance analyst, you
may have heard that SQL*Net message from
client is an idle event that can be
ignored. You must not ignore the so-called
idle events if you collect your diagnostic data in the manner I
describe in Chapter
3.
If the year were 1991, we’d be in big trouble right now, because in 1991 the data that I’ve shown in this second table wasn’t available from the Oracle kernel. But if you’ve upgraded by now to at least Oracle7, then you don’t need to settle for event counts as the “next-best thing” to response time data. The basic assumption that you can’t tell how long the Oracle kernel takes to do things is simply incorrect, and it has been since Oracle release 7.0.12.
Amdahl’s Law
The final “great advance” in Oracle performance optimization that I’ll mention is an observation published in 1967 by Gene Amdahl, which has become known as Amdahl’s Law [Amdahl (1967)]:
The performance enhancement possible with a given improvement is limited by the fraction of the execution time that the improved feature is used.
In other words, performance improvement is
proportional to how much a program uses the thing you improved.
Amdahl’s Law is why you should view response time components in
descending response time order. In Example 1-2, it’s why you
don’t work on the CPU service
“problem” before figuring out the SQL*Net
message from client
problem. If you were to reduce total CPU consumption by 50%, you’d
improve response time by only about 2%. But if you could reduce the
response time attributable to SQL*Net
message from client by the same 50%, you’ll reduce total
response time by 46%. In Example 1-2, each percentage
point of reduction in SQL*Net message from
client duration produces nearly twenty times the impact of
a percentage point of CPU service
reduction.
Amdahl’s Law is a formalization of optimization common sense. It tells you how to get the biggest “bang for the buck” from your performance improvement efforts.
All Together Now
Combining the three advances in Oracle optimization technology into one statement results in the following simple performance method:
Work first to reduce the biggest response time component of a business’ most important user action.
It sounds easy, right? Yet I can be almost certain that this is not how you optimize your Oracle system back home. It’s not what your consultants do or what your tools do. This way of “tuning” is nothing like what your books or virtually any of the other papers presented at Oracle seminars and conferences since 1980 tell you to do. So what is the missing link?
The missing link is that unless you know how to extract and interpret response time measurements from your Oracle system, you can’t implement this simple optimization method. Explaining how to extract and interpret response time measurements from your Oracle system is a main point of this book.
Tip
I hope that by the time you read this book, my claims that “this is not how you do it today” don’t make sense anymore. As I write this chapter, many factors are converging to make the type of optimization I’m describing in this book much more common among Oracle practitioners. If the book you’re holding has played an influencing role in that evolution, then so much the better.
Tools for Analyzing Response Time
The definition of response time set forth by the International Organization for Standardization is plain but useful:
Response time is the elapsed time between the end of an inquiry or demand on a computer system and the beginning of a response; for example, the length of the time between an indication of the end of an inquiry and the display of the first character of the response at a user terminal (source: http://searchnetworking.techtarget.com/sDefinition/0,,sid7_gci212896,00.html).
Response time is an objective measure of the interaction between a consumer and a provider. Consumers of computer service want the right answer with the best response time for the lowest cost. Your goal as an Oracle performance analyst is to minimize response time within the confines of the system owner’s economic constraints. The ways to do that become more evident when you consider the components of response time.
Sequence Diagram
A sequence diagram is a convenient way to depict the response time components of a user action. A sequence diagram shows the flow of control as a user action consumes time in different layers of a technology stack. The technology stack is a model that considers system components such as the business users, the network, the application software, the database kernel, and the hardware in a stratified architecture. The component at each layer in the stack demands service from the layer beneath it and supplies service to the layer above it. Figure 1-1 shows a sequence diagram for a multi-tier Oracle system.
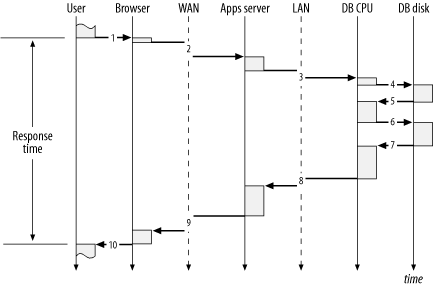
Figure 1-1 denotes the following sequence of actions, allowing us to literally see how each layer in the technology stack contributes to the consumption of response time:
After considering what she wants from the system, a user initiates a request for data from a browser by pressing the OK button. Almost instantaneously, the request arrives at the browser. The user’s perception of response time begins with the click of the OK button.
After devoting a short bit of time to rendering the pixels on the screen to make the OK button look like it has been depressed, the browser sends an HTTP packet to the wide-area network (WAN). The request spends some time on the WAN before arriving at the application server.
After executing some application code on the middle tier, the application server issues a database call via SQL*Net across the local-area network (LAN). The request spends some time on the LAN (less than a request across a WAN) before arriving at the database server.
After consuming some CPU time on the database server, the Oracle kernel process issues an operating system function call to perform a read from disk.
After consuming some time in the disk subsystem, the read call returns control of the request back to the database CPU.
After consuming more CPU time on the database server, the Oracle kernel process issues another read request.
After consuming some more time in the disk subsystem, the read call returns control of the request again to the database CPU.
After a final bit of CPU consumption on the database server, the Oracle kernel process passes the results of the application server’s database call. The return is issued via SQL*Net across the LAN.
After the application server process converts the results of the database call into the appropriate HTML, it passes the results to the browser across the WAN via HTTP.
After rendering the result on the user’s display device, the browser returns control of the request back to the user. The user’s perception of response time ends when she sees the information she requested.
Tip
A good sequence diagram reveals only the amount of detail that is appropriate for the analysis at hand. For example, to simplify the content of Figure 1-1, I have made no effort to show the tiny latencies that occur within the Browser, Apps Server, and DB CPU tiers as their operating systems’ schedulers transition processes among running and ready to run states. In some performance improvement projects, understanding this level of detail will be vital. I describe the performance impact of such state transitions in Chapter 7.
In my opinion, the ideal Oracle performance optimization tool does not exist yet. The graphical user interface of the ideal performance optimization tool would be a sequence diagram that could show how every microsecond of response time had been consumed for any specified user action. Such an application would have so much information to manage that it would have to make clever use of summary and drill-down features to show you exactly what you wanted when you wanted it.
Such an application will probably be built soon. As you shall see throughout this book, much of the information that is needed to build such an application is already available from the Oracle kernel. The biggest problems today are:
Most of the non-database tiers in a multi-tier system aren’t instrumented to provide the type of response time data that the Oracle kernel provides. Chapter 7 details the response time data that I’m talking about.
Depending upon your application architecture, it can be very difficult to collect properly scoped performance diagnostic data for a specific user action. Chapter 3 explains what constitutes proper scoping for diagnostic data, and Chapter 6 explains how to work around the data collection difficulties presented by various application architectures.
However, much of what we need already exists. Beginning with Oracle release 7.0.12, and improving ever since, the Oracle kernel is well instrumented for response time measurement. This book will help you understand exactly how to take advantage of those measurements to optimize your approach to the performance improvement of Oracle systems.
Resource Profile
A complete sequence diagram for anything but a very simple user action would show so much data that it would be difficult to use all of it. Therefore, you need a way to summarize the details of response time in a useful way. In Example 1-2, I showed a sample of such a summary, called a resource profile. A resource profile is simply a table that reveals a useful decomposition of response time. Typically, a resource profile reveals at least the following attributes:
Response time category
Total duration consumed by actions in that category
Number of calls to actions in that category
A resource profile is most useful when it lists its categories in descending order of elapsed time consumption per category. The resource profile is an especially handy format for performance analysts because it focuses your attention on exactly the problem you should solve first. The resource profile is the most important tool in my performance diagnostic repertory.
The idea of the resource profile is nothing new, actually. The idea for using the resource profile as our company’s focus was inspired by an article on profilers published in the 1980s [Bentley (1988) 3-13], which itself was based on work that Donald Knuth published in the early 1970s [Knuth (1971)]. The idea of decomposing response time into components is so sensible that you probably do it often without realizing it. Consider how you optimize your driving route to your favorite destination. Think of a “happy place” where you go when you want to feel better. For me it’s my local Woodcraft Supply store (http://www.woodcraft.com), which sells all sorts of tools that can cut fingers or crush rib cages, and all sorts of books and magazines that explain how not to.
If you live in a busy city and schedule the activity during rush-hour traffic, the resource profile for such a trip might resemble the following (expressed in minutes):
Response Time Component                Duration        # Calls     Dur/Call
----------------------------- ----------------- -------------- ------------
rush-hour expressway driving         90m    90%              2          45m
neighborhood driving                 10m    10%              2           5m
----------------------------- ----------------- -------------- ------------
Total                               100m   100%
If the store were, say, only fifteen miles away, you might find the prospect of sitting for an hour and a half in rush-hour traffic to be disappointing. Whether or not you believe that your brain works in the format of a resource profile, you probably would consider the same optimization that I’m thinking of right now: perhaps you could go to the store during an off-peak driving period.
Response Time Component                Duration        # Calls     Dur/Call
----------------------------- ----------------- -------------- ------------
off-peak expressway driving          30m    75%              2          15m
neighborhood driving                 10m    25%              2           5m
----------------------------- ----------------- -------------- ------------
Total                                40m   100%
The driving example is simple enough, and the stakes are low enough, that a formal analysis is almost definitely unnecessary. However, for more complex performance problems, the resource profile provides a convenient format for proving a point, especially when decisions about whether or not to invest lots of time and money are involved.
Resource profiles add unequivocal relevance to Oracle performance improvement projects. Example 1-3 shows a resource profile for the Oracle Payroll program described earlier in Section 1.3.1. Before the database administrators saw this resource profile, they had worked for three months fighting a perceived problem with latch contention. In desperation, they had spent several thousand dollars on a CPU upgrade, which had actually degraded the response time of the payroll action whose performance they were trying to improve. Within ten minutes of creating this resource profile, the database administrator knew exactly how to cut this program’s response time by roughly 50%. The problem and its solution are detailed in Part II of this book.
Response Time Component                Duration        # Calls     Dur/Call
----------------------------- ----------------- -------------- ------------
SQL*Net message from client       984.0s  49.6%         95,161    0.010340s
SQL*Net more data from client     418.8s  21.1%          3,345    0.125208s
db file sequential read           279.3s  14.1%         45,084    0.006196s
CPU service                       248.7s  12.5%        222,760    0.001116s
unaccounted-for                    27.9s   1.4%
latch free                         23.7s   1.2%         34,695    0.000683s
log file sync                       1.1s   0.1%            506    0.002154s
SQL*Net more data to client         0.8s   0.0%         15,982    0.000052s
log file switch completion          0.3s   0.0%              3    0.093333s
enqueue                             0.3s   0.0%            106    0.002358s
SQL*Net message to client           0.2s   0.0%         95,161    0.000003s
buffer busy waits                   0.2s   0.0%             67    0.003284s
db file scattered read              0.0s   0.0%              2    0.005000s
SQL*Net break/reset to client       0.0s   0.0%              2    0.000000s
----------------------------- ----------------- -------------- ------------
Total                           1,985.4s 100.0%
Example 1-4 shows another resource profile that saved a project from a frustrating and expensive ride down a rat hole. Before seeing the resource profile shown here, the proposed solution to this report’s performance problem was to upgrade either memory or the I/O subsystem. The resource profile proved unequivocally that upgrading either could result in no more than a 2% response time improvement. Almost all of this program’s response time was attributable to a single SQL statement that motivated nearly a billion visits to blocks stored in the database buffer cache.
Tip
You can’t tell by looking at the resource profile in Example 1-4 that the CPU
capacity was consumed by nearly a billion memory reads. Each of
the 192,072 “calls” to the CPU
service resource represents one Oracle database call
(for example, a parse, an execute, or a fetch). From the detailed
SQL trace information collected for each of these calls, I could
determine that the 192,072 database calls had issued nearly a
billion memory reads. How you can do this is detailed in Chapter 5.
Problems like this are commonly caused by operational errors like the accidental deletion of schema statistics used by the Oracle cost-based query optimizer (CBO).
Response Time Component                Duration        # Calls     Dur/Call
----------------------------- ----------------- -------------- ------------
CPU service                    48,946.7s  98.0%        192,072    0.254835s
db file sequential read           940.1s   2.0%        507,385    0.001853s
SQL*Net message from client        60.9s   0.0%        191,609    0.000318s
latch free                          2.2s   0.0%            171    0.012690s
other                               1.4s   0.0%
----------------------------- ----------------- -------------- ------------
Total                          49,951.3s 100.0%
Example 1-4 is a beautiful example of how a resource profile can free you from victimization to myth. In this case, the myth that had confused the analyst about this slow session was the proposition that a high database buffer cache hit ratio is an indication of SQL statement efficiency. The statement causing this slow session had an exceptionally high buffer cache hit ratio. It is easy to understand why, by looking at the computation of the cache hit ratio (CHR) metric for this case:
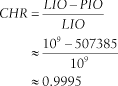
In this formula, LIO (logical I/O) represents the number of Oracle blocks obtained from Oracle memory (the database buffer cache), and PIO (physical I/O) represents the number of Oracle blocks obtained from operating system read calls.[1] The expression LIO - PIO thus represents the number of blocks obtained from Oracle memory that did not motivate an operating system read call.
Although most analysts would probably consider a ratio value of 0.9995 to be “good,” it is of course not “perfect.” In the absence of the data shown in Example 1-4, many analysts I’ve met would have assumed that it was the imperfection in the cache hit ratio that was causing the performance problem. But the resource profile shows clearly that even if the 507,385 physical read operations could have been serviced from the database buffer cache, the best possible total time savings would have been only 940.1 seconds. The maximum possible impact of fixing this “problem” would have been to shave a 14-hour execution by a mere 16 minutes.
Considering the performance of user actions using the resource profile format has revolutionized the effectiveness of many performance analysts. For starters, it is the perfect tool for determining what to work on first, in accordance with our stated objective:
Work first to reduce the biggest response time component of a business’ most important user action.
Another huge payoff of using the resource profile format is that it is virtually impossible for a performance problem to hide from it. The informal proof of this conjecture requires only two steps:
Proof: If something is a response time problem, then it shows up in the resource profile. If it’s not a response time problem, then it’s not a performance problem. QED
Part II of this book describes how to create resource profiles from which performance problems cannot hide.
Method R
The real goal of this book is not just to help you make an Oracle system go faster. The real goal of this book is to optimize the project that makes an Oracle system go faster. I don’t just want to help you make one system faster. I want to help you make any system faster, and I want you to be able to accomplish that task in the most economically efficient way possible for your business. Method R is the method I will describe by which you can achieve this goal. Method R is in fact the basis for the remainder of this book.
Method R is conceptually very simple. As you should expect, it is merely a formalization of the simple “Work first to reduce the biggest response time component of a business’ most important user action” objective that you’ve seen many times by now.
Who Uses the Method
An immediately noticeable distinction of Method R is the type of person who will be required to execute it. Method R specifically can not be performed in isolation by a technician who has no interest in your business. As I have said, the goal of Method R is to improve the overall value of the system to the business. This goal cannot be achieved in isolation from the business. But how does a person who leads the execution of Method R fit into an information technology department?
The abominable smokestack
Most large companies organize their technical infrastructure support staff in a manner that I call the “abominable smokestacks,” like the departmental segmentation shown in Figure 1-2. Organizational structures like this increase the difficulty of optimizing the performance of a system, for one fundamental reason:
Compartmentalized organizational units tend to optimize in isolation from other organizational units, resulting in locally optimized components. Even if they succeed in doing this, it’s not necessarily good enough. A system consisting of locally optimized components is not necessarily itself an optimized system.
One of Goldratt’s many contributions to the body of system optimization knowledge is a compelling illustration of how local optimization does not necessarily lead to global optimization [Goldratt (1992)].
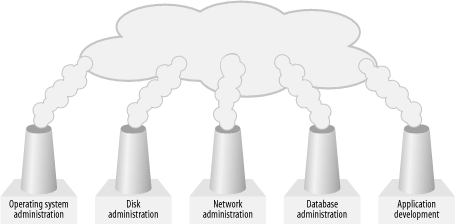
The smokestack mentality is pervasive. Even the abstract submission forms we use to participate in Oracle conferences require that we choose a smokestack for each of our presentations (conference organizers tend to call them tracks instead of smokestacks). There is, for example, one track for papers pertaining to database tuning, and a completely distinct track for papers pertaining to operating system tuning. What if a performance optimization solution requires that attention be paid iteratively to both components of the technology stack? I believe the mere attempt at categorization discourages analysts from considering such solutions. At least analysts who do implement solutions that span stack layers are ensured of having a difficult time choosing the perfect track for their paper proposals.
Tip
One classic aspect of segmentation is particularly troublesome for almost every Oracle system owner I’ve ever talked with: the distinction between application developers and database administrators. Which group is responsible for system performance? The answer is both. There are performance problems that application developers will not detect without assistance from database administrators. Likewise, there are performance problems that database administrators will not be able to repair without assistance from application developers.
The optimal performance analyst
A company’s best defense against performance problems begins with a good performance analyst who can diagnose and discourse intelligently in all the layers of the technology stack. In the context of Figure 1-2, this person is able to engage successfully “in the smoke.” The performance analyst can navigate above the smokestacks long enough to diagnose which pipes to dive into. And the best analyst has the knowledge, intelligence, charisma, and motivation to drive change in the interactions among smokestacks once he’s proven where the best leverage is.
Of the dozens of great Oracle performance analysts I’ve had the honor of meeting, most share a common set of behavioral qualities that I believe form the basis for their success. The best means I know for describing the capabilities of these talented analysts is a structure described by Jim Kennedy and Anna Everest [Kennedy and Everest (1994)], which decomposes personal behavioral qualities into four groups:
- Education/experience/knowledge factors
In the education/experience/knowledge category, the capabilities required of the optimal analyst are knowledge of the business goals, processes, and user actions that comprise the life of the business. The optimal analyst knows enough about finance to understand the types of input information that will be required for a financially-minded project sponsor to make informed investment decisions during a performance improvement project. And the optimal analyst of course understands the technical components of his application system, including the hardware, the operating system, the database server, the application programs, and any other computing tiers that join clients to servers. I describe many important technical factors in Part II of this book.
- Intellectual factors
The optimal performance analyst exhibits several intellectual factors as well. Foremost, I believe, is the strong sense of relevance—the ability to understand what’s important and what’s not. Sense of relevance is a broad category. It combines the attributes of perceptiveness, common sense, and good judgment. General problem solving skills are indispensable, as is the ability to acquire and assimilate new information quickly.
- Interpersonal factors
The optimal performance analyst exhibits several interpersonal factors. Empathy is key to acquiring accurate information from users, business owners, and component administration staff. Poise is critical for maintaining order during a performance crisis, especially during the regularly scheduled panic phase of a project. Self-confidence is necessary to inspire adequate morale among the various project victims and perpetrators to ensure that the project is allowed to complete. The optimal analyst is tactful and successful in creating collaborative effort to implement a solution plan.
- Motivational factors
Finally, the optimal performance analyst exhibits several important motivational factors. She is customer oriented and interested in the business. She enjoys a difficult challenge, and she is resourceful. I have found the best performance analysts to be always mindful that technical, intellectual, interpersonal, and motivational challenges are all surmountable, but that different problem types often require drastically different solution approaches. The best performance analysts seem not only to understand this, but to actually thrive on the variety.
Your role
As a result of buying this book, I want you to become so confident in your performance problem diagnosis skills that a scenario like the following doesn’t scare you one bit:
Scene: Big meeting. Participants include several infrastructure department managers, you, and a special guest: the CEO, whose concerns about online order form performance are critical enough that he has descended upon your meeting to find out what you’re going to do about it....
Senior manager of the system administration department (“System manager”): In two weeks, we’re going to upgrade our CPU capacity, at a cost to the business of US$65,000 in hardware and upgraded software license fees. However, we expect that because we’re doubling our CPU speeds, this upgrade will improve performance significantly for our users.
CEO: (Nods.) We must improve the performance of our online order form, or we’ll lose one of our biggest retail customers.
You: But our online order form consumes CPU service for only about 1.2 seconds of the order form’s 45-second commit time. Even if we could totally eliminate the response time consumed by CPU service, we would make only about a one-second improvement in the form’s response time.
System manager: I disagree. I think there are so many unexplained discrepancies in the response time data you’re looking at that there’s no way you can prove what you’re saying.
You: Let’s cover this offline. I’ll show you how I know.
(Later, after reconvening the meeting.)
System manager: Okay, I get it. He’s right. Upgrading our CPU capacity won’t help order form performance in the way that we’d hoped.
You: But by modifying our workload in a way that I can describe, we can achieve at least a 95% improvement in the form’s commit response time, without having to spend the money on upgrading our CPUs. As you can see in this profile of the order form’s response time, upgrading CPU capacity wouldn’t have helped us here anyway.
I’ve witnessed the results of a lot of conversations that began this way but never veered back on-course when it was the You character’s first turn to speak. The result is often horrifying. A company works its way through the alphabet in search of something that might help performance. Sometimes it stops only when the company runs out of time or money, or both.
Perhaps even more painful to watch is the conversation in which the You character does speak up on cue but then is essentially shouted down by a group of people who don’t believe the data. Unless you can defend your diagnostic data set all the way to its origin—and how it fits in with the data your debaters are collecting—you stand a frighteningly large chance of losing important debates, even when you’re right.
Overcoming Common Objections
I hope that I’ve written this book effectively enough that you will want to try Method R on your own system. If you can work alone, then most of the obstacles along your way will be purely technical, and you’ll probably do a great job of figuring those out. I’ve tried hard to help you overcome those with the information in this book.
However, it’s more likely that improving the performance of your system will be a collaborative effort. You’ll probably have to engage your colleagues in order to implement your recommendations. The activities you recommend as a result of using Method R will fall into one of two categories:
Your colleagues have heard the ideas before and rejected them
They’ve never heard the ideas before
Otherwise, your system would have been fixed by now. Either way, you will probably find yourself in an environment that is ready to challenge your ideas. To make any progress, you will have to justify your recommendations in language that makes sense to the people who doubt you.
Tip
Justifying your recommendations this way is healthy for you to do anyway, even in the friendliest of environments where your words become other people’s deeds almost instantaneously.
The most effective ways I’ve found to justify such recommendations are:
- Proof-of-concept tests
There’s no better way to prove a result than to actually demonstrate it. Dave Ensor describes this as the Jeweler’s Method. Any good jeweler will place interesting merchandise into a prospective customer’s hands as early in the sales process as possible. Holding the piece activates all the buyer’s senses in appreciating the beauty and goodness of the thing being sold. The buyer’s full imagination goes to work for the seller as the buyer locks in on the vision of how much better life will become if only the thing being held can be obtained. The method works wonderfully for big-ticket items, including jewelry, cars, houses, boats, and system performance. There’s probably no surer way to build enthusiasm for your proposal than to let your users actually feel how much better their lives will become as a result of your work.
- Direct statistics that make sense to end users
If proof-of-concept tests are too complicated to provide, the next best thing is to speak in direct statistics that make sense to end users. There are only three acceptable units of measure for such statistics:
Your local currency
The duration by which you’ll improve someone’s response time
The number of business actions per unit of time by which you’ll improve someone’s throughput
Any other measure will cause one of two problems. Either your argument will be too weak to convince the people you’re trying to persuade, or, worse yet, you’ll succeed in your persuasions, but because you were thinking in the wrong units of measure you’ll risk producing end results with inadequate “real” benefit. Real benefit is always measured in units of either money or time. Succeeding in your proposal but failing in your end result of course causes an erosion of your credibility for future recommendations.
- Track record of actualized predictions
If you have the luxury of a strong reputation to enhance your persuasive power, then merely making your wishes known may be enough to inspire action. However, if this is the case, beware. Every prediction you make runs the risk of eroding your credibility. Even if you have the power to convert your instructions into other people’s tasks, I strongly encourage you to assess your recommendations privately using proof-of-concept tests or direct statistics that make sense to end users. Don’t borrow from the account of your own credibility until you’re certain of your recommendations.
“But my whole system is slow”
At hotsos.com, we use Method R for our living. After using the method many times, I can state categorically that the most difficult step of Method R is one that’s not even listed: it is the step of convincing people to use it. The first objection my colleagues and I encounter to our focus on user actions is as predictable as the sunrise:
“But my whole system is slow.”
“I need to tune my whole system, not just one user.”
“When are you going to come out with a method that helps me tune my whole system?”
We hear it everywhere we go.
What if the whole system is slow? Practitioners often react nervously to a performance improvement method that restricts analysis to just one user action at a time. Especially if users perceive that the “whole system” is slow, there is often an overwhelming compulsion to begin an analysis with the collection of system-wide statistics. The fear is that if you restrict the scope of analysis to anything less than the entire system, you might miss something important. Well, in fact, a focus on prioritized user actions does cause you to miss some things:
A focus on high-priority user actions causes you to overlook irrelevant performance data. By “irrelevant,” I mean any data that would abate your progress in identifying and repairing your system’s most important performance problem.
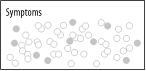
Here’s why Method R works regardless of whether a system’s problem is an individual user action or a whole mess of different user actions. Figure 1-3 shows the first information that analysts get when they learn of system performance problems. Legitimate information about performance problems usually comes first from the business in the form of user complaints.
Tip
It is possible for information providers to be the first to know about performance problems. In Chapter 9 I describe one way in which you can acquire such a priori knowledge. But it is rare for information providers to know about performance problems before their information consumers tell them.
Upon receipt of such information, the first impulse of most analysts is to establish a cause-effect relationship between the symptoms being observed and one or more root causes that might be motivating the symptoms. I wholeheartedly agree that this step is the right step. However, many projects fail because analysts fail to establish the correct cause-effect relationships. A core strength of Method R is that it allows you to determine cause-effect relationships more quickly and accurately than with any other method.
Figure 1-4 shows why. It depicts three possible sets of cause-effect relationships between problem root causes and performance problem symptoms. Understanding the effectiveness of Method R for each of these scenarios compared to conventional tuning methods will help you decide for yourself whether Method R is an effective system-wide optimization or not. The three possible scenarios depicted in Figure 1-4 are:
At one extreme, case (a) depicts that every user-discernible symptom on the system is caused by a single “universal” root cause.
In case (b), there is a many-to-many relationship between symptoms and root causes. Some symptoms have two or more contributory root causes, and some root causes contribute to more than one symptom.
At the other extreme, case (c) depicts a situation in which every symptom is linked to its own distinct root cause. No single root cause creates negative performance impact for more than one user action.
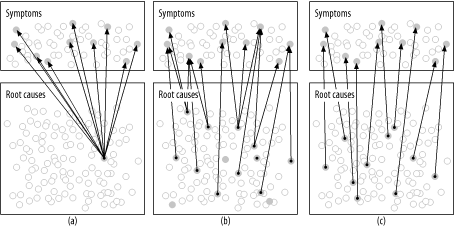
Of course it is easy to draw pictures of cause-effect relationships between root causes and performance problem symptoms. It’s another matter entirely to determine such cause-effect relationships in reality. The ability to do this is, I believe, the most distinguishing strength of Method R. Let me explain.
For problems resembling Figure 1-4(a), Method R works quite well. Even if you were to completely botch the business prioritization task inherent in the method’s step 1, you’d still stumble upon the root cause in the first diagnostic data you examined. The reason is simple. If all symptoms have the same root cause, then no matter which symptom you investigate, you’ll find the single, universal root cause in that symptom’s response time profile.
Method R also works well for problems resembling Figure 1-4(b) and (c). In these cases, the only way to provide system-wide relief is to respond to each of the root causes that contributes to a symptom. Constraints on analyst labor (your time) probably make it impossible to respond to all the symptoms simultaneously, so it will probably be important to prioritize which activities you’ll conduct first. This requirement is precisely the motive for the work prioritization inherent in Method R. Remembering that the true goal of any performance improvement project is economic, the proper way to prioritize the project activities is to respond to the most important symptoms first. Method R is distinctive in that it encourages alignment of project priorities with business priorities.
By contrast, let’s examine the effectiveness of Method C for each of the same three scenarios. Remember, the first step of Method C is:
Hypothesize that some performance metric x has an unacceptable value.
In the context of Figure 1-4, this step is analogous to searching for the shaded circles in the portion of the diagram labeled root causes. After identifying probable root causes of performance problems, Method C next requires the analyst to establish a cause-effect relationship between root causes and symptoms. One problem with Method C is that it forces you to compute this cause-effect relationship rather more by accident than by plan. The conventional method for determining this cause-effect relationship is literally to “fix” something and then see what impact you created. It’s a trial-and-error approach.
The challenge to succeeding with Method C is how quickly you can identify the right “unacceptable” system metric value. The longer it takes you to find it, the longer your project will drag on. Certainly, your chances of finding the right problem to solve are greatest when there’s only one problem in the whole system. However, it’s not certain that finding the root cause will be easy, even in an “easy” case like Figure 1-4(a). Just because there’s only one root cause for a bunch of problems doesn’t mean that there will be only one system-wide performance statistic that looks “unacceptable.”
The real problem with Method C becomes apparent when you consider its effectiveness in response to the cases shown in Figure 1-4(b) and (c). In both of these cases, when we look “from the bottom up,” there are several potential root causes to choose from. How will you determine which root cause to work on first? The best prioritization scheme would be to “follow the arrows” backward from the most important business symptoms to their root causes. The root causes you’d like to address first are the ones causing the most important symptoms.
However, Method C creates a big problem for you at this point:
System-wide performance metrics provide insufficient information to enable you to draw the cause-effect arrows.
You cannot reliably compute the cause-effect relationships shown in Figure 1-4 unless you measure response time consumption for each user action—“from the top down” in the context of the drawing. Understanding what information is required to draw the cause-effect arrows reveals both the crippling flaw of Method C and the distinctive strength of Method R. It is impossible to draw the cause-effect arrows reliably from root causes to symptoms (from the bottom to the top). However, it is very easy to draw the arrows from symptoms to root causes (from the top down), because the resource profile format for targeted user actions tells you exactly where the arrows belong.
Without the cause-effect arrows, a project is rudderless. Any legitimate prioritization of performance improvement activities must be driven top-down by the economic priorities of the business. Without the arrows, you can’t prioritize your responses to the internal performance metrics you might find in your Statspack reports. Without the arrows, about the only place you can turn is to “cost accounting” metrics like hit ratios, but unfortunately, these metrics don’t reliably correspond to the economic motives of the business. The Oracle Payroll situation that I described earlier in this chapter was rudderless for three months. The project concluded on the day that the team acquired the data shown in Example 1-3.
Tip
Ironically, then, the popular objection to Method R actually showcases the method’s greatest advantage. We in fact designed Method R specifically to respond efficiently to systems afflicted with several performance root causes at once.
The reason Method R works so well in system-wide performance crises is that your “whole system” is not a single entity; it’s a collection of user actions, some more important than others. Your slow user actions may not all be slow for the same reason. If they’re not, then how will you decide which root cause to attack first? The smart way is by prioritizing your user actions in descending order of value to your business. What if all your slow user actions actually are caused by the same root cause? Then it’s your lucky day, because the first diagnostic data you collect for a single process is going to show you the root cause of your single system-wide performance problem. When you fix it for one session, you’ll have fixed it for every session. Table 1-1 summarizes the merits of conventional methods versus the new method.
Figure 1-4 case | Method C effectiveness | Method R effectiveness |
(a) | Effective in some cases. Existence of only one problem root cause increases the likelihood that this root cause will be prominent in the analysis of system-wide statistics. | Effective. Even if business prioritization is performed incorrectly, the method will successfully identify the sole root cause on the first attempt. |
(b) | Unacceptable. Inability to link cause with effect means that problems are attacked “from the bottom up” in an order that may not suit business priorities. | Effective. Business prioritization of user actions ensures that the most important root cause will be found and addressed first. |
(c) | Unacceptable. Same reasons as for (b). | Effective. Same reasons as above. |
“The method only works if the problem is the database”
Another common objection to Method R is the perception that it is incapable of finding and responding to performance problems whose root causes originate outside the database tier. In a world whose new applications are almost all complicated multi-tier affairs, this perception causes a feeling that Method R is severely limited in its effective scope.
Method R itself is actually not restricted at all in this manner. Notice that nowhere in the four-step method is there any directive to collect response time data just for the database. The perception of database focus arises in the implementation of step 2, which is the step in which you will collect detailed response time diagnostic data. This book, as you shall see, provides coverage only of the response time metrics produced specifically by the Oracle kernel. There are several reasons for my writing the book this way:
When performance problems occur, people tend to point the finger of blame first at the least well-understood component of a system. Thus, the Oracle database is often the first component blamed for performance problems. The Oracle kernel indeed emits sufficient diagnostic data to enable you to prove conclusively whether or not a performance problem’s root cause lies within the database kernel.
At the time of this writing, the Oracle kernel is in fact the most robustly instrumented layer in the technology stack; however, many analysts fail to exploit the diagnostic power inherent in the data this instrumentation emits. Oracle’s diagnostic instrumentation model is very robust in spite of its simplicity and efficiency (Chapter 7). Vendors of other layers in the application technology stack have already begun to catch onto this notion. I believe that the response time diagnostic instrumentation built into the Oracle kernel will become the standard model for instrumenting other application tiers.
Even without further instrumentation of non-database tiers, if your performance problem is in the database, Method R helps you solve it quickly and efficiently. If your problem is not caused by something going on in your database, then Method R helps you prove that fact quickly and efficiently. Regardless of where in your architecture your root cause resides, Method R prevents you from trying to fix the wrong problem.
The proof is in the experience. Method R routinely leads us to the doorstep of problems whose repair must be enacted either inside or outside of the database, including such cases as:
Query mistakes caused by inefficiently written application SQL statements, poor data designs, ill-advised indexing strategies, data density mistakes, etc.
Application software mistakes caused by excessive parsing, poorly designed serialization (locking) mechanisms, misuse (or disuse) of array processing features, etc.
Operational mistakes caused by errors in collection of statistics used by the cost-based optimizer, accidental schema changes (e.g., dropped indexes), inattention to full file systems, etc.
Network mistakes caused by software configuration mistakes, hardware faults, topology design errors, etc.
Disk I/O mistakes caused by poorly sized caches, imbalances in I/O load to different devices, etc.
Capacity planning mistakes resulting in capacity shortages of resources like CPU, memory, disk, network, etc.
“The method is unconventional”
Even if Method R could prove to be the best thing since the invention of rows and columns, I expect for some pockets of resistance to exist for at least a couple of years after the publication of this book. The method is new and different, and it’s not what people are accustomed to seeing. As more practitioners, books, and tools adopt the techniques described in this book, I expect that resistance will fade. In the meantime, some of your colleagues are going to require careful explanations about why you’re recommending a completely unconventional performance optimization method that doesn’t rely on Statspack or any of the several popular performance monitoring tools for which your company may have paid dearly. They may cite your use of an unconventional method as one of the reasons to reject your proposals.
One of my goals for this book is certainly to arm you with enough knowledge about Oracle technology that you can exploit your data to its fullest diagnostic capacity. I hope by the end of this book I’ll have given you enough ammunition that you can defend your recommendations to the limit of their validity. I hope this is enough to level the playing field for you so that any debates about your proposed performance improvement activities can be judged on their economic merits, and not on the name of the method you used to derive them.
Evaluation of Effectiveness
Earlier in this chapter, I listed eight criteria against which I believe you should judge a performance improvement method. I’ll finish the chapter by describing how Method R has measured up against these criteria in contrast to conventional methods:
- Impact
Method R causes you to produce the highest possible impact because you are always focused on the goal that has meaning to the business: the response time of targeted user actions.
- Efficiency
Method R provides excellent project efficiency because it keeps you focused on the top priorities for the business, and because it allows you to make fully informed decisions during every step of the project. Project efficiency is in fact the method’s key design constraint.
- Measurability
Method R uses end-user response time as its measurement criterion, not internal technical metrics that may or may not translate directly to end-user benefit.
- Predictive capacity
Method R gives the unprecedented ability to predict the impact of a proposed tuning activity upon a targeted user action, without having to invest in expensive experimentation.
- Reliability
Method R performs reliability in virtually every performance problem situation imaginable; a distinction of the method is its ability to pinpoint the root cause of any type of performance problem without having to resort to experience, intuition, or luck.
- Determinism
Method R eliminates diagnostic guesswork first by maintaining your focus on business priority, and second by providing a foolproof method for determining the true relationships between problem symptoms and their root causes.
- Finiteness
Method R has a clearly stated termination condition. The method provides the distinctive capacity to prove when no further optimization effort is economically justifiable.
- Practicality
Method R is a teachable method that has been used successfully by hundreds of analysts of widely varying experience levels to resolve Oracle performance problems quickly and permanently.
[1] This formula has many problems other than the one illustrated in this example. Many authors—including Adams, Lewis, Kyte, and myself—have identified dozens of critical flaws in the definition of the database buffer cache hit ratio statistic. See especially [Lewis (2003)] for more information.
Get Optimizing Oracle Performance now with the O’Reilly learning platform.
O’Reilly members experience books, live events, courses curated by job role, and more from O’Reilly and nearly 200 top publishers.

