Make sure that the investment return your portfolio is earning sufficient compensation for the risks you take.
In investing, risk and return walk hand in hand—the more risk you accept, the more return you should earn. Some investors are so afraid of losing money that they play it safe, purchasing certificates of deposit or hiding money under the mattress. Unfortunately, no investment is without risk. Even if you hide money in your mattress, it can burn in a fire with the rest of your belongings! At the other end of the spectrum, you might be willing to take big risks to grab big gains. In this case, the key is to accept risks only when the payoff justifies the potential losses. By understanding the risks you take and balancing those risks with your investment return, you can reach your financial goals without unnecessary jolts to your system.
Risk comes in many forms, and each type of investment carries its own unique combination of risks. For some investments, risk decreases the longer you own them. For others, the opposite is true. For example, over short periods of time, stocks carry a lot of risk. 1931 turned in the largest one-year loss in stocks (the market index of large-cap stocks in this example)—over 43 percent. Even over a few 10-year periods, market indexes have lost principal. However, when you evaluate stock market indexes over 20-year periods, they have never lost money. Conversely, with an FDIC-insured savings account, you won’t lose any of the money you save. However, inflation decreases the buying power of your money, so that you are guaranteed to have less buying power when you keep your money in savings for long periods of time. The dollar amount might be the same, but the value of your savings is less in terms of what you can buy with them.
To get a handle on the types of risks you face and how to tame them, let’s review. Market risk is the chance that you will lose money on a bad investment. However, the level of market risk depends on how you invest and how long you hold your investments. If you count on a stock tip from a taxi driver, your risk might be high no matter how long you hold your investment. However, if you choose your investments wisely, invest in a diversified portfolio [Hack #74] , and hold for the long term, your market risk is barely noticeable.
For a one-year period, the return on the large-cap stock market index is a roller-coaster ride from a one-year high of 54 percent in 1933 to a heart-stopping low of 43.3 percent in 1931. However, for the past 75 years, a hypothetical investment in the large-cap stock market index including reinvested dividends has averaged a compound annual return of about 11 percent.
Tip
Holding-period risk is the risk that you might have to sell an investment prematurely—at a time when its value is depressed.
Economic risk is the danger you face when the entire economy tanks. Fortunately, recessions don’t occur that often and don’t last that long (although it feels like forever at the time). Interest rates going up, war breaking out, and financial problems occurring in another part of the world all affect the stock market. In the late 1990s, dot-com stocks and initial public offerings (IPOs) were darlings, but when the economy went into hibernation, those investments along with other overvalued stocks dropped like rocks.
When things get tough, investors return to the basics: earnings. Regardless of how steamy the story on a hot prospect, the stock price will still drop if the company doesn’t have earnings and steady earnings growth to support its price. The bottom line is to avoid economic risk. Don’t speculate. Invest.
Inflation risk is a hidden time bomb. Unlike market risk and economic risk, inflation risk compounds over time. The danger of inflation risk is that cautious people put their money in safe investments for years, only to find that their savings end up worth less than what they started with.
Inflation risk is the loss of purchasing power. Just think of the last time you said something like “I remember when a loaf of bread was only (25 cents, 1 dollar, 2 dollars, fill in your price).” For example, at the end of 30 years of three percent inflation, 1 dollar is worth only about 40 cents. If inflation is 3 percent, and your savings account pays 2 percent interest, you are losing just over 1 percent of your money to inflation each year.
Bond investors [Hack #80] are faced with interest-rate risk, which is the chance that your investment loses value because its fixed rate of return doesn’t change when interest rates rise. The bond value falls because its rate of return is not as attractive as the going market interest rate. For short-term investments such as CDs, reinvestment risk is the risk that rates will be lower when your investment matures.
Tip
If you want to learn more about risk and its effect on your investments, take the “Understanding Risk” course at http://www.riskgrades.com/retail/clients/RetailCourse/index.cgi. You must register (no charge) at the site to access its educational materials.
Retirees face one additional risk: outliving their assets. When you plan for retirement [Hack #96] , you make assumptions about how long you will live and how much money you will need. Although you can adjust your spending to compensate for lower investment returns, it’s too late to make changes when you live longer than you anticipated. You can mitigate this risk in several ways. Using a ripe old age in your retirement plan can help you build up enough assets to last. Consider purchasing long-term care insurance when you retire to cover the high costs of assisted living and nursing homes. A reverse mortgage on your home can provide expenses for living. The bottom line: if you don’t plan in some way for a long life, your choices could be unappealing.
Modern portfolio theory is an approach to investing that evaluates the market as a whole, and evaluates investments based statistically on their short-term volatility and long-term returns. In this philosophy, volatility equals risk. The goal of modern portfolio theory’s statistical calculations is to identify your acceptable level of risk and the portfolio that provides the greatest return for that level of risk. Fundamental investors calculate risks a little differently. They analyze each company’s fundamentals to find companies whose stock price is likely to increase due to company growth, quality, strength, and an attractive stock price. They manage risk by diversifying their portfolios [Hack #74] and by buying stocks when their potential return exceeds potential losses by a wide enough margin. However, you can use the statistical risk measures spawned by modern portfolio theory to evaluate risk inherent in the individual investments in your portfolio. You can also evaluate the potential investments you’re studying to take into account risk along with fundamental criteria.
Tip
MoneyChimp.com provides a good introduction to modern portfolio theory at http://www.moneychimp.com/articles/risk/riskintro.htm.
Standard deviation is one way to measure an investment’s volatility and does so by figuring out how far any given year’s return might be from the average return. In statistics, the average is known as the mean. To assess your risk tolerance given a standard deviation value (32 percent for example), simply ask yourself, “Would I be comfortable if this stock dropped 32 percent in one year?” If the answer is no, the stock is too risky for you. Move on.
The formula for standard deviation is shown in Example 4-52.
Example 4-52. The formula for calculating standard deviation of data
Standard deviation =
(X - mean)2 / N
This formula contains the following elements:
-
X Represents each datum being evaluated (in this case, the annual returns)
-
mean Represents the average of all the data
-
N Represents the number of data points
The Sharpe Ratio [Hack #65] measures reward to risk. For the Sharpe Ratio, reward is measured by the amount of return an investment provides in excess of the return of a risk-free investment (cash). For example, if an investment returns 4 percent and saving money in a savings account returns .75 percent, the reward is 3.25 percent. The risk is measured by the standard deviation of the investment’s returns. The result of this ratio is the amount of excess return an investment generates per unit of risk.
The formula for the Sharpe Ratio is shown in Example 4-53.
This formula contains the following elements:
-
i Represents the investment you are evaluating
-
ri Represents the average annual return for investment
i-
Rf Represents the best available return for a risk-free security such as cash or a 90-day U.S. Treasury bill
-
StdDev(i) Represents the standard deviation of
ri
If two investments have the same return, the one with the higher Sharpe Ratio provides its return with less volatility.
Tip
To learn more about the Sharpe Ratio, visit http://www.moneychimp.com/articles/risk/sharpe_ratio.htm.
Beta measures how much an investment changes compared to changes in the overall market. By definition, the beta of a benchmark, such as an index, is 1.0. An investment with a beta of 1.25 performs 25 percent better than its benchmark index in up markets and 25 percent worse in down markets, all other factors remaining constant.
A low beta doesn’t necessarily mean that an investment isn’t volatile. It simply means the investment’s volatility is low in relation to the volatility of its benchmark index. For example, a beta of 0.70 indicates that an investment performs 30 percent worse than the index in up markets and 30 percent better in down markets.
Tip
Beta isn’t a perfect measure. Because it rates investments based on their past performance, the beta for an investment doesn’t reflect changes to risk, such as when a utility gets involved in the merchant energy business. In addition, beta is a better measure of risk for short holding periods, when price fluctuations add risk. However, for long-term investors, short-term price fluctuations are meaningless. For example, Warren Buffett doesn’t care for beta as a measure, because he considers the volatility of the market as an opportunity to invest in attractive companies.
Alpha represents the difference between an investment’s actual and expected returns, given the level of risk identified by its beta value. A positive alpha value indicates that an investment has performed better than you would expect based on its beta. A negative alpha value means that an investment has performed worse than beta predicts. The formula for alpha is shown in Example 4-54.
Example 4-54. The formula for calculating alpha
Alpha = Excess return - ((Beta x (Benchmark return - Treasury return))
This formula contains the following elements:
-
Excess return Represents the excess return that the investment provides above the treasury return
-
Benchmark return Represents the total return of the investment’s corresponding benchmark index
-
Treasury return Represents the return on a three-month Treasury bill
In pure statistics, R-Squared [Hack #35] measures how closely a set of data maps to a straight line. However, in investing, R-Squared can represent several things. If you use R-Squared to evaluate a company’s sales or earnings, it tells you how predictable the company’s performance has been. For mutual funds, R-Squared is often calculated by comparing a fund’s performance to the benchmark index performance. In this case, R-Squared represents the percentage of the fund’s performance that is explained by the performance of its benchmark index.
An R-Squared equal to 1 means the data and the straight line are a total match. For stock earnings, this means that you can predict the company’s future earnings with reasonable confidence. For a mutual fund, an R-Squared of 1 (sometimes normalized to 100) means that the fund completely follows the index [Hack #68] .
All these risk values can be helpful, but on the Web, they’re not often presented for stocks. Don’t fret. The RiskGrades.com web site (http://www.riskgrades.com) provides tools that make it easy to see whether you’re balancing risk and return.
The RiskGrade developed by the Risk Metrics Group measures volatility and is similar to standard deviation and the Sharpe Ratio in that respect. However, it differs in several ways. First, it weights historical data so the measure places more emphasis on current conditions. It is also normalized so that a RiskGrade value of 100 represents the typical risk inherent in the global equity market. In addition, the RiskGrade takes into account currency risk, which is the risk that currency exchange rates affect an investment’s value. For example, if you use U.S. dollars to purchase a European stock, the RiskGrade incorporates both the risk in the stock itself and the currency risk between dollars and euros.
Several RiskGrade tools help you evaluate potential investments or those already in your portfolio. However, all of these tools help you identify whether the risks you take are appropriate for your risk tolerance and for the returns that your investments provide.
If you want a RiskGrade for only one investment, choose Get a RiskGrade from the menu bar. Select the market in which the investment trades, such as US Equity, type the ticker symbol in the box, and click Go. The ticker and RiskGrade for the company appear in the Get a RiskGrade dialog box. If your tolerance for risk is average, look for RiskGrades below 80. If a RiskGrade is above 100, which indicates risk greater than that of the global equity market, check the investment’s return for above-average performance.
To view a chart of the change in risk over time, illustrated in Figure 4-29, type a ticker in the Get a RiskGrade dialog box and click RiskChart. You can select periods from three months to one year or specify the date range you want to evaluate. You can also compare a company’s risk to a benchmark index or to other companies. To add other companies to the chart, type additional ticker symbols in the Symbols box separated by commas. To add benchmarks, type the ticker for the benchmark in the “Add benchmarks to chart” box at the bottom of the page and click Add.
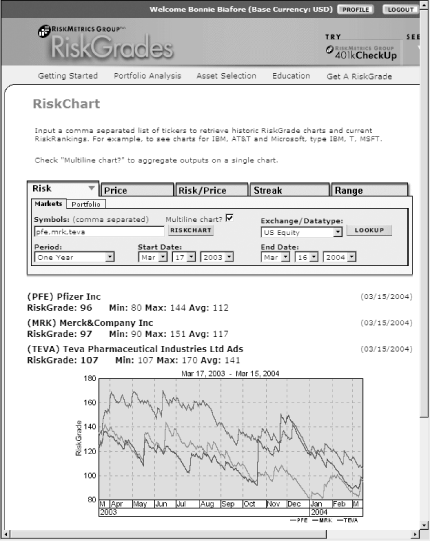
You can use the RiskChart in several ways. You can determine whether an existing investment or one that you are considering has a RiskGrade within your risk tolerance. For example, if you are risk averse, look for RiskGrades below 50 and also consider investments whose risk tends to stay low over time. You can also use a RiskChart showing several companies to choose companies with acceptable risk for further study.
To use the portfolio risk analysis tools, you must first enter your portfolio. RiskGrades.com portfolios can contain stocks, mutual funds and trusts, bonds, equity options, and cash. If your portfolio is extensive, you can upload a file to build your portfolio. However, if you own only a few investments, it’s easier to type in the ticker and number of shares. You can create multiple portfolios, for instance if you want to evaluate the risk levels of funds earmarked for different purposes, such as retirement and college tuition. To create a portfolio, choose Portfolio Analysis→My Portfolio from the RiskGrades.com menu bar and then click Create New Portfolio.
The portfolio table displays the risk statistics for the investments in a portfolio, as shown in Figure 4-30. As you become more familiar with the RiskGrade measures, you can modify the fields that appear in the portfolio table to include the ones you want. However, you can use the default fields in the portfolio table to analyze your risks:
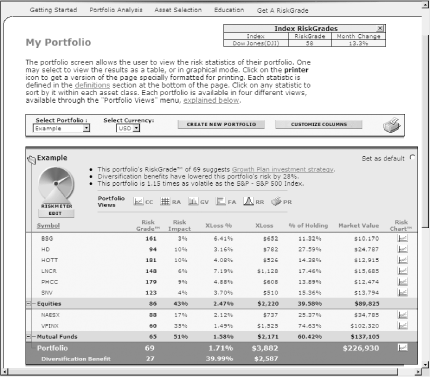
Figure 4-30. Review risk measures for individual stocks and an entire portfolio in the RiskGrades.com portfolio table
- RiskGrade
Check the RiskGrade value for each investment to see if it is within your risk tolerance. Depending on your risk tolerance, you might want all your investments to carry low RiskGrades. However, you might also accept higher risk for some investments if the risk and return for your total portfolio risk meets your risk tolerance needs.
- RiskImpact
This measure shows how much risk an investment contributes to a portfolio. RiskImpact uses both the RiskGrade and the percentage that an investment represents in a portfolio. If one investment’s RiskImpact is too high, you can reduce the size of the holding or replace it with a less risky investment.
- XLoss and XLoss %
These measures show the potential loss an investment might contribute to your portfolio. Make sure that you can accept a dollar or percentage loss of this size for the investment. If not, look for a less risky investment.
- RiskChart
You can access the RiskChart for any investment by clicking its RiskChart icon in the portfolio table.
The RiskGrade, XLoss, XLoss %, and other measures for the entire portfolio appear at the bottom of the portfolio table. In addition, you can see the benefit in risk reduction provided by the diversification of your portfolio.
If you like to sleep well at night, you want to own a portfolio of investments that matches your tolerance for risk. But what’s the point of owning a risky investment if it doesn’t produce sufficient return to make its risk worthwhile? RiskGrades.com makes risk versus return easy to see on the Risk versus Return chart. Click the icon in the portfolio table for the RA portfolio view to display a chart such as the one in Figure 4-31. Investments above the straight line in the chart provide sufficient return for their level of risk.
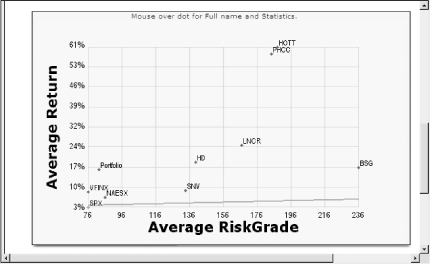
Figure 4-31. The RiskGrades.com Risk versus Return chart makes it easy to spot companies too risky for their return
However, you can also use the chart to spot investments that don’t carry their weight compared to other companies in your portfolio. Ideally, you should receive a higher return as you accept higher risk. This means that points in the graph should increase on the Y-axis as they move further to the right on the X-axis. In Figure 4-31, most of the holdings do just this. However, Bisys Group (BSG) is at the right edge of the chart with a RiskGrade of 236, and its return is less than Home Depot’s, which carries a RiskGrade of 139.
RiskGrades.com also enables you to evaluate the effect of buying and selling on your portfolio before you make your trades. Choose Portfolio Analysis→Portfolio Simulation→What If? Then you can sell investments in the portfolio, add shares to existing investment, or add shares of new investments. Click Run Analysis to view your new RiskGrade, diversification benefit, and other measures.
The Reuters Investor web site (http://www.investor.reuters.com) tests companies six ways, looking for signs that investors aren’t as keen on the stock as they once were. These tests don’t use standard statistical risk measures, and a failing grade might not be anything to worry about. For example, a company fails the Estimate Revisions test if only one analyst downgrades the stock, regardless of how many analysts have held the course. However, several failing results can flag that you should check up on your stock. To check the status of the risk alerts for a company, open the Reuters Investor stock page for the company and click Risk Alerts in the navigation bar. The six risk alert tests are as follows:
- The Analyst Recommendation Test
Fails a company if the average analyst rating (1.0 indicating a strong buy and 5.0 indicating a strong sell) has increased in the past four weeks
- The Estimate Revisions Test
Fails a company if at least one analyst in the past week reduced the EPS estimates for the current or next fiscal year
- The Shorted Shares Test
Fails a company if short selling has increased during the past week
- The Institutional Selling Test
Fails a company if institutions such as mutual funds sold more shares in the company than they bought in the most recent reporting period
- The Price Deterioration Test
Fails a company whose shares have performed at least 35 percent worse than the price performance of the industry average
- The Price Momentum Test
Looks at price performance over the past four weeks compared to price performance in the nine weeks prior to that
Get Online Investing Hacks now with the O’Reilly learning platform.
O’Reilly members experience books, live events, courses curated by job role, and more from O’Reilly and nearly 200 top publishers.

