Buy-and-hold investing doesn’t mean buy-and-forget. Compare a company’s performance to the same period a year ago to look for signs of trouble with its fundamentals.
For long-term investors, comparing shorter-term financial results can raise red flags about a company’s current condition. By comparing recent annual or quarterly results to the same period a year ago, you might receive early warning of a problem that could turn into a full-blown disaster over time. There is a wide range of figures you should evaluate on a company’s income statement, balance sheet, and cash flow statement.
The formula for calculating percentage change is shown in Example 4-49.
Example 4-49. Formula for percentage change
Percentage change = ((Ending Value / Initial Value) - 1) * 100
Tip
Companies usually highlight changes in key figures in their quarterly and annual earnings releases. The financial tables that accompany these press releases include data for the most recent and comparable year-ago periods.
A good source of SEC filing data for public companies is Price Waterhouse Coopers Global’s EdgarScan [Hack #18] (http://edgarscan.pwcglobal.com). Here you can download a single spreadsheet that has a company’s annual and quarterly data going back ten years.
After you’ve downloaded the spreadsheet for a company, isolate any two columns (either for two years or two quarters) and calculate the percentage change in a third column. Copy the formula down the column, and you’ll be able to spot any significant changes in particular data points, as illustrated in Figure 4-18. The percentage changes in column D use a formula such as the one shown in Example 4-50, formatted to display as a percentage to one decimal point.
Example 4-50. Typical Excel formula for calculating percentage change
Typical Excel Percentage Change Formula = ((C6 / B6) - 1)
Tip
In Excel, the formula does not multiply the result by 100, because you can apply formatting to show the value as a percentage.
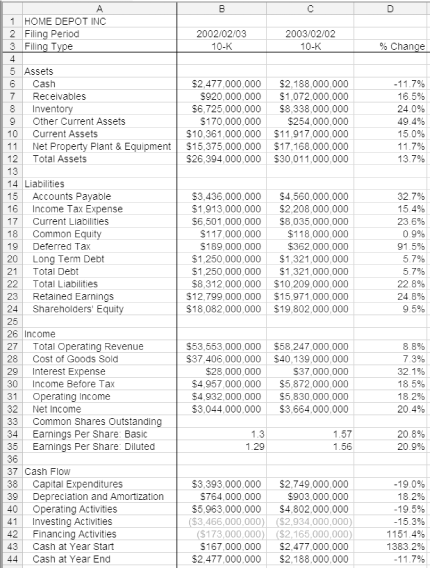
Figure 4-18. Examine the year-over-year changes in a company’s financials to spot potential problems
When you compare quarterly results, use the same quarter from the current year and the prior year. For example, compare the fourth quarters for fiscal year 2003 and 2002. Many companies do better during specific times of the year. For example, bookstores and retailers do particularly well in the last calendar quarter because of holiday buying. Home improvement stores often do better during the summer months.
If you spot significant deterioration, you should dig deeper to determine the cause. Read the management’s discussion in the annual report or SEC filings, check recent press releases and news, or ask investor relations representatives at the company directly for an explanation.
Tip
A negative percentage change doesn’t necessarily represent deteriorating performance. For example, in Figure 4-18, the negative percentage change in cell D41 is an improvement. In addition, if one of the values in a calculation is positive and the other is negative, the resulting percentage calculation is meaningless.
Here are some key figures to consider when evaluating year-over-year changes:
- Assets
If a company’s current assets are growing, it may mean that the company is accumulating cash, a positive sign. On the other hand, if the receivables component of current assets is increasing, the company may be having trouble collecting on customer invoices, which wouldn’t be good. Look at the changes in cash, receivables, and inventory to find an explanation for the changes. Home Depot’s total asset growth of 13.7 percent is in line with the growth of most of its asset categories, with the exception of the decline in cash and the large growth in inventories and other current assets. The $84 million increase in other total assets makes up less than 0.2 percent of total assets of $30 billion, so the change doesn’t have a large impact on the company’s position. But the levels of cash and inventories do require a closer look.
- Cash
Is the value of cash and cash equivalents (such as securities that can be readily sold) declining? If so, what are the reasons for the drop? Has the company been using its cash recently to expand operations? Or have profit margins or revenues been falling, which requires the company to use more of its cash position to fund operations? Home Depot’s cash has declined 11.7 percent from the prior year, but the dollar value of cash on hand closely matches the increase in receivables. If the company has problems collecting on unpaid bills, it could be a sign of trouble. For now, however, the company is quite satisfied with having over $2 billion in cash and indicates that this amount will easily take care of its expansion plans for the next few years.
- Inventory
Are inventories growing, shrinking, or stable? Too much inventory might mean that the company’s resources are tied up in warehouses and not being sold to customers. The company might be ramping up for a future expansion, or it might have a dud product that consumers don’t want. So what about Home Depot’s 24 percent growth in inventory for the year? In its annual report, the company explains that upgrades in technology contribute to better inventory management, with stores averaging 8 percent more inventory at the end of the year than at the beginning. In a retail business, empty shelves mean no sales and disappointed customers, so better-stocked stores are a plus. Home Depot is also expanding the appliance departments in its stores and has become the third largest appliance retailer in the U.S. Refrigerators, stoves, washers, and dryers are more expensive than screws and tools, so this could also contribute to the increase in the value of its inventory. Since total revenues and profits are strong, this one-year change isn’t a major cause for concern (although it might be a good idea to watch this item for any long-term changes).
- Accounts Payable
If this liability is growing, is it because the company can’t pay its bills on time or because they are rapidly growing their business? When a company grows, it buys more supplies, which leads to an increase in accounts payable. If accounts payable have increased without a corresponding increase in sales, check turnover ratios and cash flow for signs of a cash crisis. Maybe the company has negotiated better terms with its suppliers. If accounts payable have declined, have the company’s sales also been falling? Home Depot’s accounts payable grew 32.7 percent over the prior year, a bit higher than the increase in total inventories for the year. The company does have plenty of cash to pay its bills and is rapidly expanding its business, so the year-over-year change doesn’t raise a big red flag.
- Debt
Is the company paying down its long-term or short-term debt? Or have they borrowed more money from the bank, increasing their level of debt? If they’ve been borrowing money, find out if it has been to fund expansion or to simply pay their current bills. Home Depot is building more stores each year, so the 5.7 percent increase in total debt is likely due to their aggressive growth plans. By borrowing money, the company can build more stores and thus increase their profits at a faster rate. In its annual report, the company reports that their long-term debt-to-equity ratio at the end of the year was 6.7 percent and their credit quality is excellent, so the company is putting the borrowed money to good use.
- Interest Expense
If interest expense is growing faster than sales and profits, determine the cause. If a company is borrowing additional money to finance operations or an expansion, then their interest expense might rise. But if the increase is due to higher interest rates on its debt, particularly in businesses that require a lot of capital to build plants or other high-cost items, interest expense increases could lead to decreased net profits in the future. Home Depot paid significantly more in interest in the most recent year, but even with the 32.1 percent increase, the company points out in its annual report that interest expense as a percent of sales was 0.0 percent for the year. Since their net income of $3.6 billion was nearly 100 times the $37 million they paid in interest, the increase isn’t a significant concern at this point.
- Revenues
A company must grow revenues over the long term in order to grow its profits. A company can increase its profit margins only so far by increasing productivity, lowering costs, or raising prices. Falling revenues can be a sign of trouble. However, small companies often grow faster than large companies, so revenue growth typically slows as small companies mature. The 8.8 percent gain in total operating revenue for Home Depot is well in line with expectations for a company of its size.
- Pre-Tax Income
Changes in pre-tax profits can often be a warning sign of trouble. If pre-tax income has fallen, is it because of slowing revenue growth, increased expenses, or external factors such as an unfavorable economic climate? Home Depot grew its income before taxes 18.5 percent over the prior year, a strong showing for a large company.
- Earnings Per Share (EPS)
EPS is probably the most closely tracked figure when investors research public companies. As a result, it’s usually quite easy to find a company’s explanation for its falling earnings or slowing growth. It’s up to you, however, to determine whether the factors that contributed to the decline will continue to affect the company’s future. Home Depot’s EPS growth rate of 20.9 percent (on a diluted basis) is excellent for a company of its size.
- Capital Expenditures
A decline in capital expenditures might mean that the company is stretching the usable life of its capital assets or is not currently funding expansion. However, reduction in this measure might indicate cash flow problems. In Home Depot’s annual report for the year, management attributes the 19.0 percent decline in capital expenditures to a shift in the timing of spending for future store openings. The company opened nearly the same number of stores in the most recent year as they did in the prior year, and also expected to spend significantly more in capital expenditures in the next year, so this one-year slowdown isn’t a big concern.
If you see a percentage change that appears to be out of range, it might not mean anything at all. A big change in a relatively small value isn’t necessarily a cause for concern. For example, a large increase in interest expense in a company with very low debt might not raise red flags because, in this case, even a small amount of additional debt results in a large percentage increase in interest expense.
Tip
No company is perfect. Sometimes a company will stumble and turn in financial results that aren’t so favorable when compared to the prior year. This doesn’t necessarily mean that the company is in big trouble—it could be a temporary problem that management will be able to remedy. If your research on the changes doesn’t satisfy you, watch the company with additional care for the next several quarters. If things don’t turn around, consider selling the stock [Hack #86] before that short-term predicament turns into a long-term problem.
Be aware of a company’s exposure to general economic trends, as well. A cyclical company’s financial statements will show a downturn as the economy contracts, but this might not indicate management’s lack of expertise.
—Douglas Gerlach
Get Online Investing Hacks now with the O’Reilly learning platform.
O’Reilly members experience books, live events, courses curated by job role, and more from O’Reilly and nearly 200 top publishers.

