Chapter 8. Charts
OpenDocument includes a powerful specification for making charts. You may place a chart in a word processing document, a drawing, a presentation, or a spreadsheet.
Chart Terminology
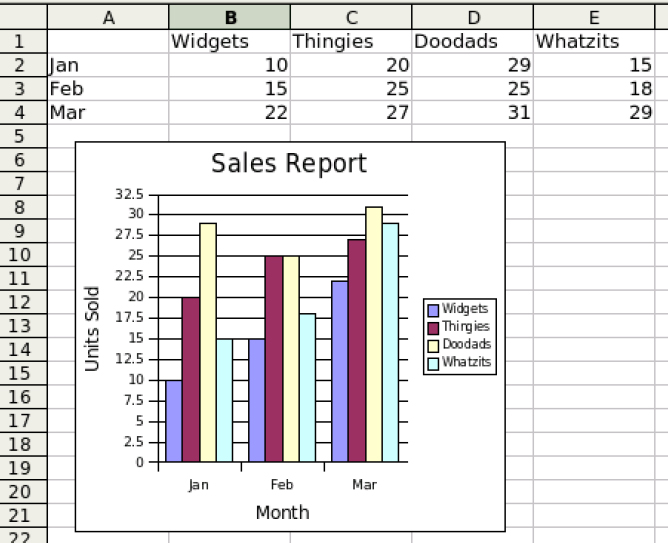
Before proceeding to the actual XML, let's define some of the terms that are used when talking about charts. Consider the spreadsheet section shown in Figure 8.1, “Chart Derived from Spreadsheet”. In this chart, there are three categories: January, February, and March–the months of the first quarter of the year. Each of the items sold has a series of three data points or values. The values are the numbers in the spreadsheet, and they appear on the y-axis.
Figure 8.1. Chart Derived from Spreadsheet
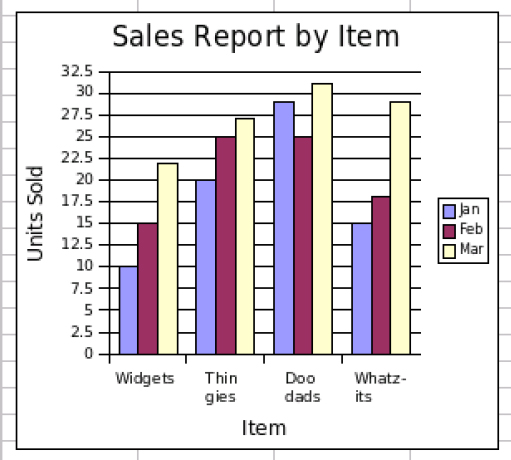
It is also possible to describe a chart where each row is a series of data points, and the columns are the categories. This produces a chart of sales by items sold, shown in Figure 8.2, “Chart with Series in Rows”. Here, each month has a series of four data points, one for each item.
Figure 8.2. Chart with Series in Rows
In an x-y chart (such as the scatter chart in Figure 8.3, “Scatter Chart”), the x-axis is called the domain, as in the domain of an algebraic function.
Figure 8.3. Scatter Chart
Charts are Objects
Rather than being inserted directly into the content.xml, the chart is inserted ...
Get OASIS OpenDocument Essentials: Using OASIS OpenDocument XML now with the O’Reilly learning platform.
O’Reilly members experience books, live events, courses curated by job role, and more from O’Reilly and nearly 200 top publishers.

