10.4 Annex 4 – Details about the Pedagogical Example
In this section, complementary details are provided for the example introduced in Chapter 3: numerical values, samples and cost functions.
10.4.1 Data Samples
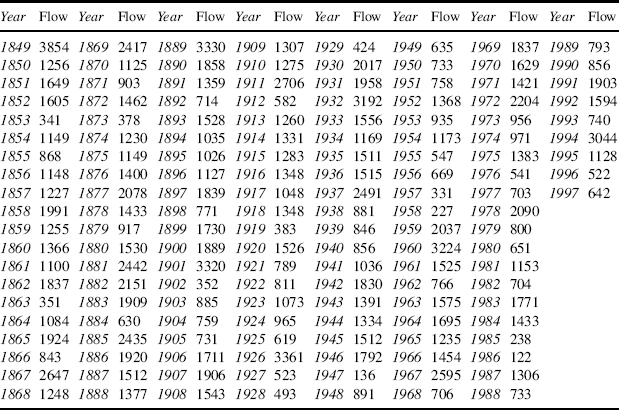
The following Table 10.1 provides the detailed flow recorded as (Qj)j=1. . .n: one maximal value per year.
Table 10.1 Flow records.
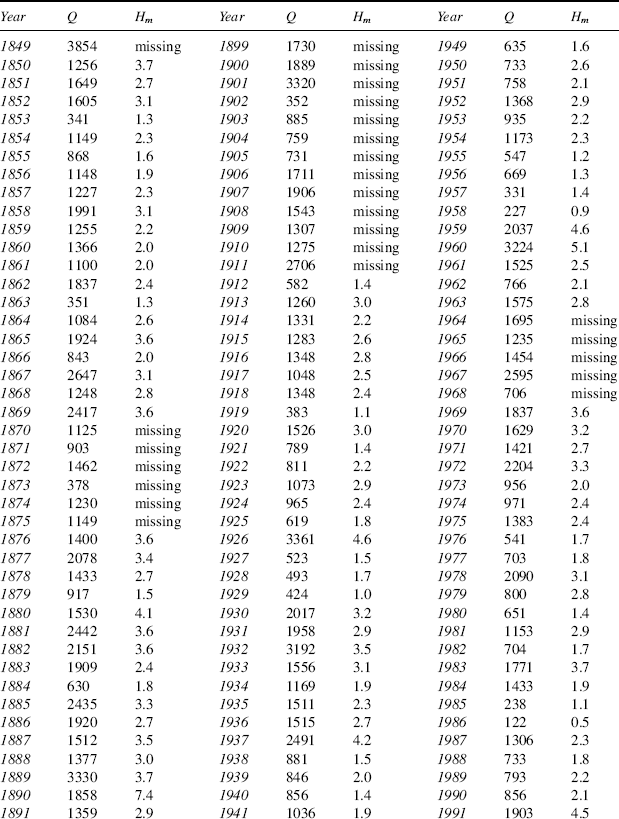
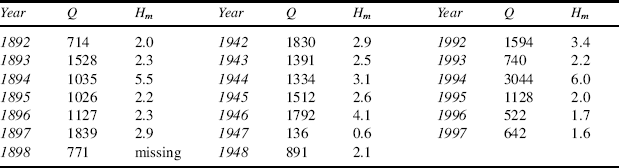
The following Table 10.2 provides the simultaneous records (Qj, Hmj)j=1. . .n of yearly maxima for flow (in m3/s) and water depth (in m). Data is missing for water depth, evidencing the unreliability of local water depth measurement, thus blurring direct statistical estimation on that variable (see Chapter 3). Significant metrological noise generally affects water depth records (Figure 10.7): they have been simulated intentionally on the basis of the original flow records and random sampling of the flood model (other sources of uncertainties sampled along the pdf mentioned below), to which a multiplicative + −10 % uniform noise has been added.
Figure 10.7 Flow-height records.
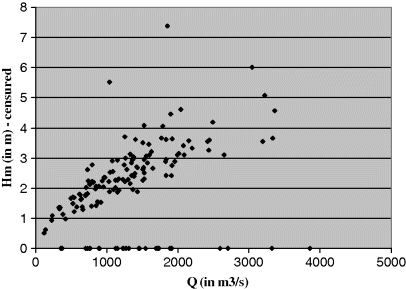
Table 10.2 Flow–heights records.
The following Table 10.3 provides the ...
Get Modelling Under Risk and Uncertainty: An Introduction to Statistical, Phenomenological and Computational Methods now with the O’Reilly learning platform.
O’Reilly members experience books, live events, courses curated by job role, and more from O’Reilly and nearly 200 top publishers.

