Using Multilevel Categories
Excel allows you to categorize your categories. This sounds redundant, but a quick example illustrates the technique. Suppose you want to plot the data shown in Figure 26-9 (The resulting chart is shown in Figure 26-10). The series are months and the categories are the sales offices located in different cities. The city sales are further classified by state, however. To create this multilevel chart, you simply select the data, including both columns of category information, and plot in the normal manner. Excel recognizes the second category column and creates the appropriate subcategories.
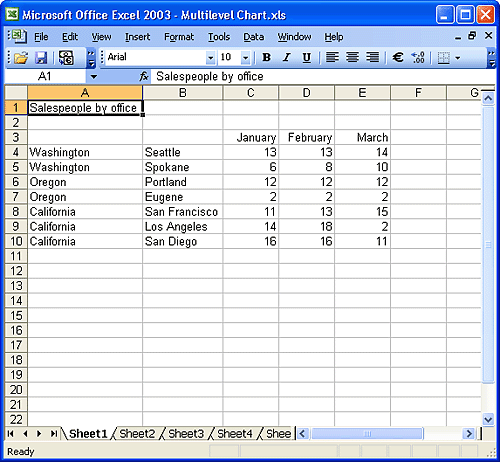
Figure 26-9. This worksheet uses ...
Get Microsoft® Office Excel 2003 Inside Out now with the O’Reilly learning platform.
O’Reilly members experience books, live events, courses curated by job role, and more from O’Reilly and nearly 200 top publishers.

