Plotting or Marking Every nth Point
Figure 26-5 shows a two-series line chart that has become difficult to read because the data points are too close together. (Each series now has 100 points; it's easy to imagine how much less effective this chart would become if its series grew to multiple hundreds of points.) Redrawing the series lines without markers wouldn't solve the problem in this hypothetical case; some points are required, but perhaps not all. One way around the difficulty is to plot only the points at some regular interval—every fifth point, for example. Another way is to plot all the points but suppress most of the markers.
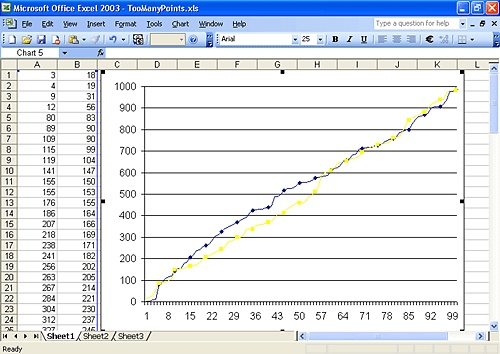
Figure 26-5. The ...
Get Microsoft® Office Excel 2003 Inside Out now with the O’Reilly learning platform.
O’Reilly members experience books, live events, courses curated by job role, and more from O’Reilly and nearly 200 top publishers.

