Chapter 10. Creating Charts and Graphics
Chapter at a Glance
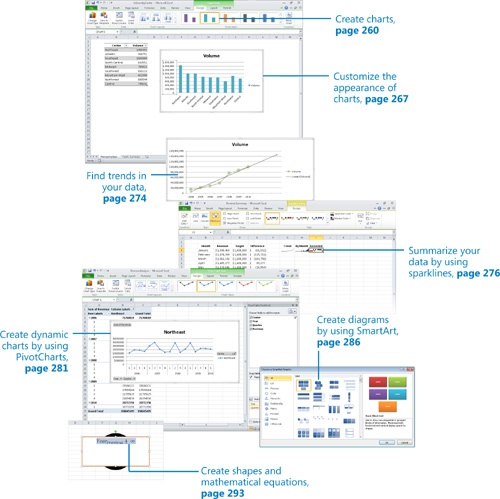
In this chapter, you will learn how to | |
|---|---|
â | |
â | |
â | |
â | |
â | |
â | |
â | |
When you enter data into a Microsoft Excel 2010 worksheet, you create a record of important events, whether they are individual sales, sales for an hour of a day, or the price of a product. What a list of values in cells canât communicate easily, however, is the overall trends ...
Get Microsoft® Excel® 2010: Step by Step now with the O’Reilly learning platform.
O’Reilly members experience books, live events, courses curated by job role, and more from O’Reilly and nearly 200 top publishers.

