Attaching the Debugger to the Host Process
With this mode, you have to open your plug-in solution in Visual Studio 2012 first and put breakpoints where you want to stop and debug your code. To set a breakpoint, press F9 (see Figure 23.34).
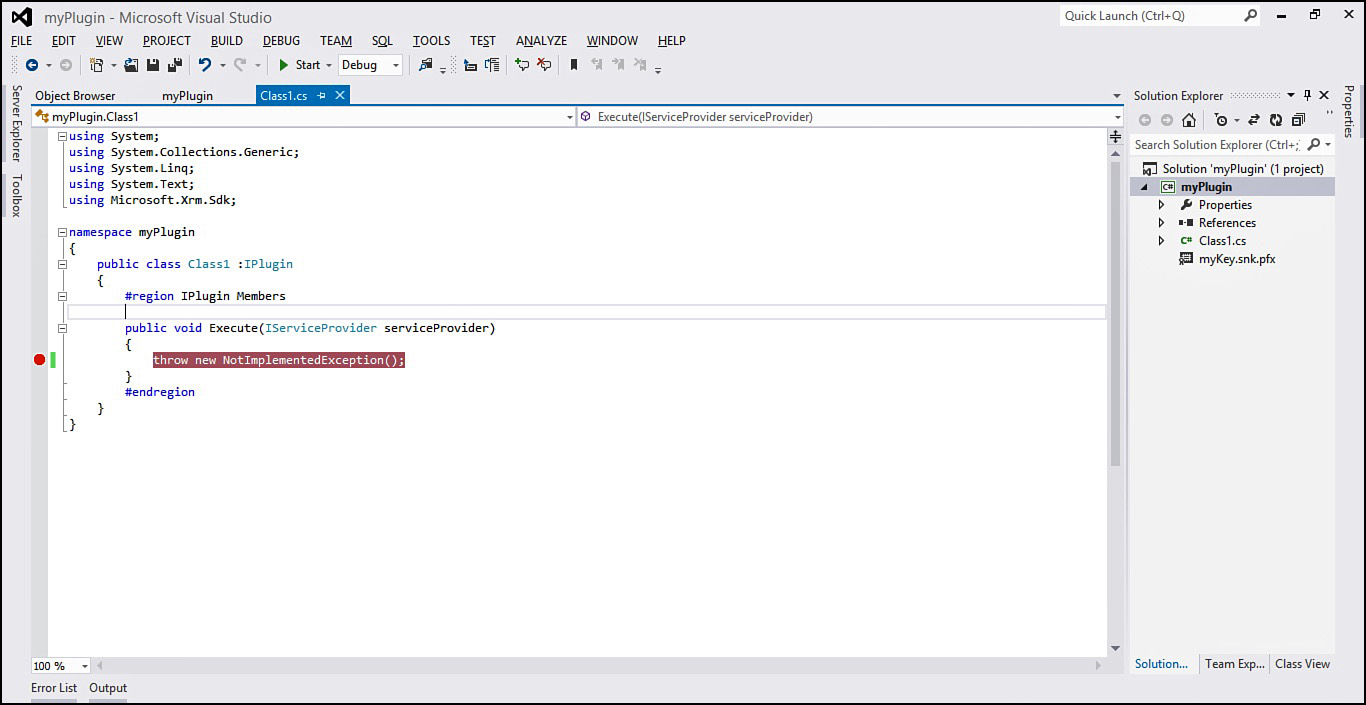
FIGURE 23.34 Setting breakpoints on your code.
You must start the debugger by attaching the Visual Studio debugger to the w3wp.exe process for example to debug an online plug-in. To do that, go to the Debug menu and select the Attach to Process option (see Figure 23.35).
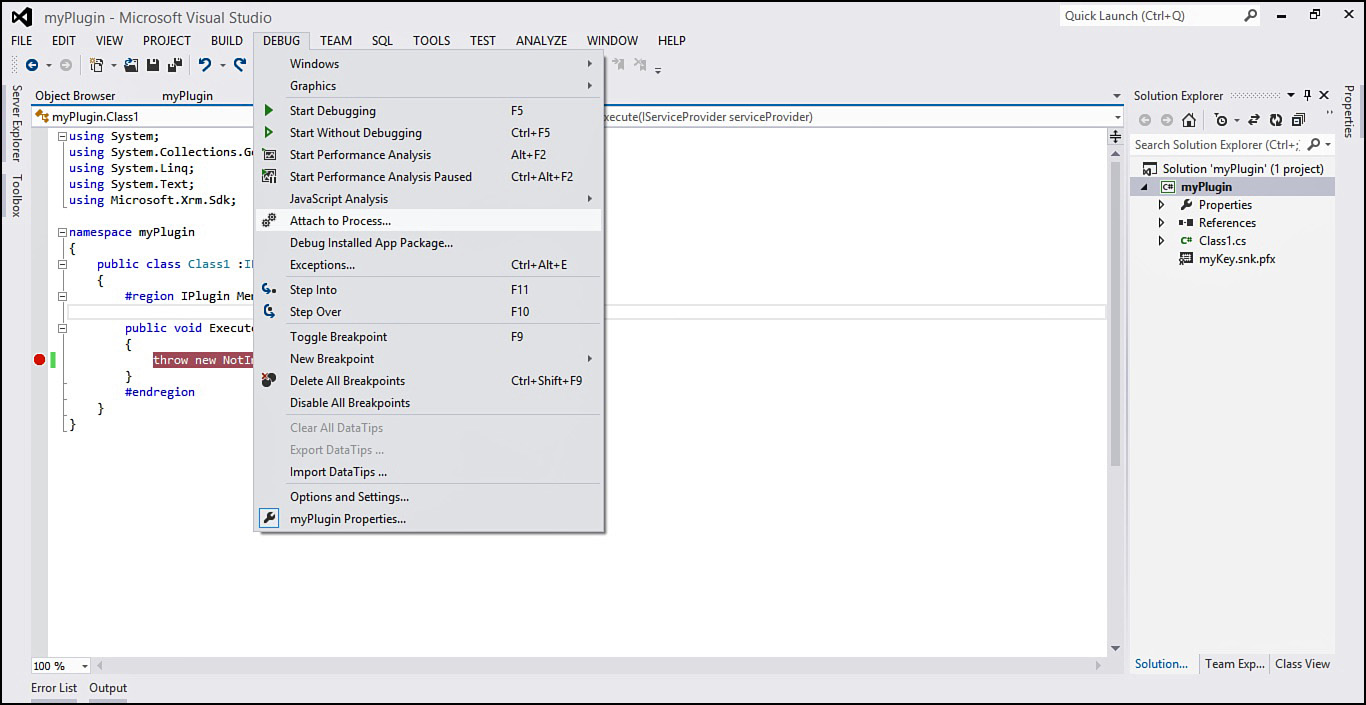
FIGURE 23.35 Attach to process menu option. ...
Get Microsoft Dynamics CRM 2013 Unleashed now with the O’Reilly learning platform.
O’Reilly members experience books, live events, courses curated by job role, and more from O’Reilly and nearly 200 top publishers.

