5-MINUTE BAR SYSTEMS: RSI EXTREMES WITH 16.67-HOUR MOVING AVERAGE FILTER
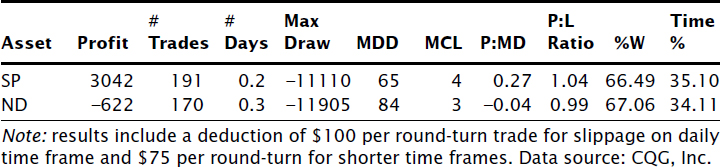
The data displayed in Table 5.14 for the 5-minute bar time frame includes history from June 25, 2003, to January 30, 2004.
When comparing the performance in Table 5.14 to that of Table 5.13, two notable improvements occurred as the time frames of our bars were shortened: the maximum number of consecutive losses and win/loss ratio for the system. This was a direct result of our maintaining the same RSI and percentage stop-loss parameters despite the shortening of time frames. Because mean reversion on shorter time frames requires a smaller magnitude of price movement, likelihood of mean reversion became greater vis-à-vis the probability of achieving the identical fail-safe stop level. As a result we saw improvements in win/loss ratio and consecutive losses as our P:MD dropped.
TABLE 5.13 RSI extremes with 50-hour moving average filter and 1% stop for ND; 0.5% stop for SP.
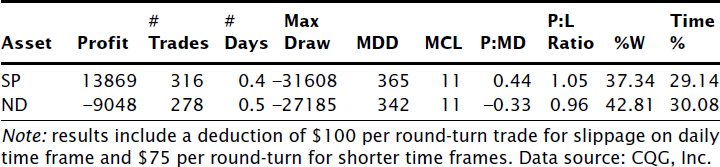
TABLE 5.14 RSI extremes with 16.67-hour moving average filter and 1% stop for ND; 0.5% stop for SP.
Get Mechanical Trading Systems: Pairing Trader Psychology with Technical Analysis now with the O’Reilly learning platform.
O’Reilly members experience books, live events, courses curated by job role, and more from O’Reilly and nearly 200 top publishers.

