5.2 DESCRIPTIVE STATISTICS
5.2.1 Overview
Descriptive statistics describe variables in a number of ways. The histogram in Figure 5.1 for the variable Length displays the frequency distribution. It can be seen that most of the values are centered around 0.55, with a highest value around 0.85, and a lowest value around 0.05. Most of the values are between 0.3 and 0.7 and the distribution is approximately normal; however, it is slightly skewed.
Descriptive statistics allow us to quantify precisely these descriptions of the data. They calculate different metrics for defining the center of the variable (central tendency), they define metrics to understand the range of values (variation), and they quantify the shape of the distribution.
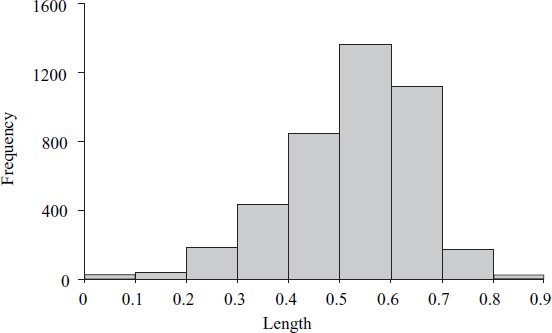
Figure 5.1. Histogram of variable Length
5.2.2 Central Tendency
Mode
The mode is the most commonly reported value for a particular variable. It is illustrated using the following variable whose values are:
3, 4, 5, 6, 7, 7, 7, 8, 8, 9
The mode would be the value 7 since there are three occurrences of 7 (more than any other value). It is a useful indication of the central tendency of a variable, since the most frequently occurring value is often towards the center of the variable range.
When there is more than one value with the same (and highest) number of occurrences, either all values are reported or a mid-point is selected. For example, for the following ...
Get Making Sense of Data: A Practical Guide to Exploratory Data Analysis and Data Mining now with the O’Reilly learning platform.
O’Reilly members experience books, live events, courses curated by job role, and more from O’Reilly and nearly 200 top publishers.

