A.4 F-DISTRIBUTION
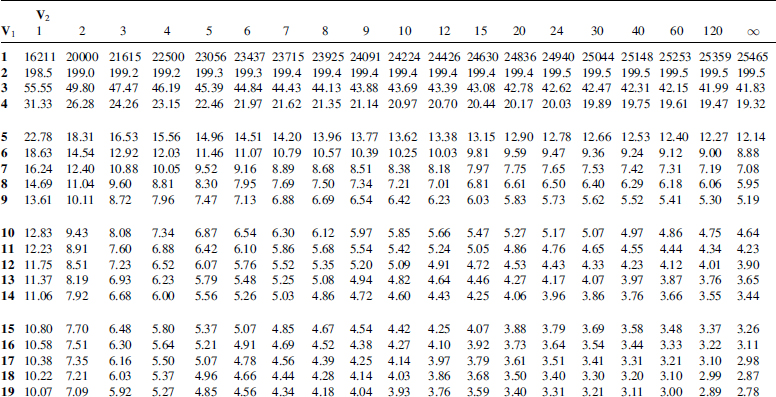
Tables A.4, A.5, A.6 and A.7 show the F-statistic for four different values of α: 0.1, 0.05, 0.01 and 0.005. v1 is the number of degrees of freedom for the numerator and v2 is the number of degrees of freedom for the denominator. Figure A.4 illustrates the F-distribution. For example, to look up a critical value for the F-statistics where the numerator degrees of freedom (v1) are 6 and the denominator degrees of freedom (v2) are 15 and α is 0.05, using Table A.5, is 3.94.
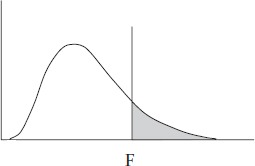
Figure A.4. F-distribution
Table A.4. F-distribution where α = 0.1
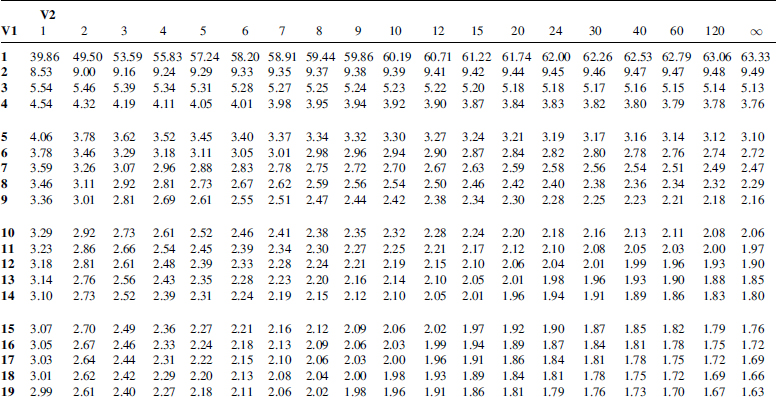
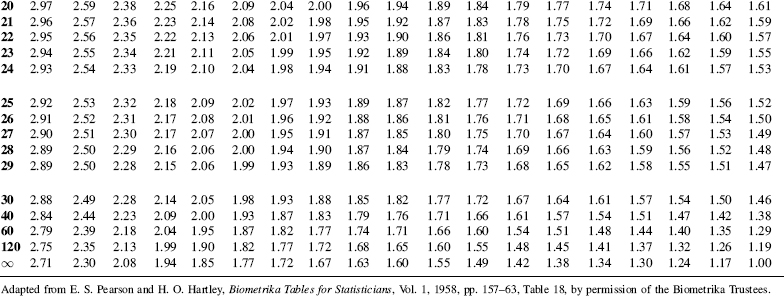
Table A.5. F-distribution where α = 0.05
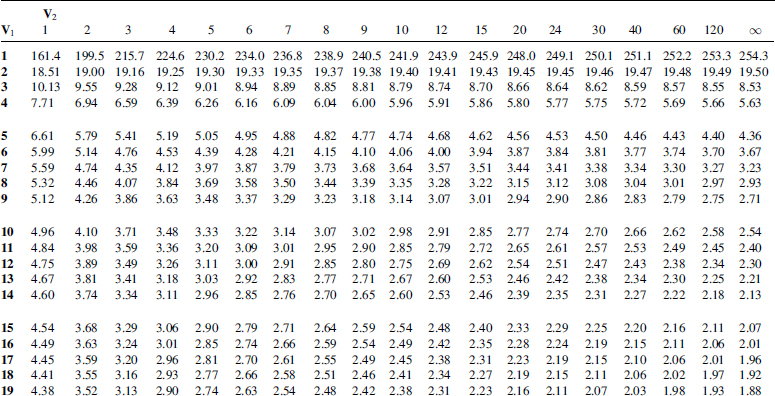
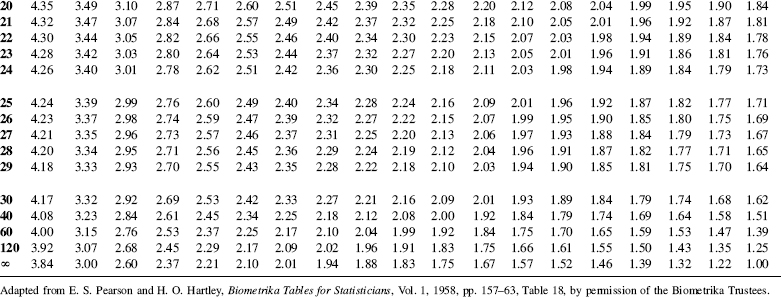
Table A.6. F-distribution where α = 0.01
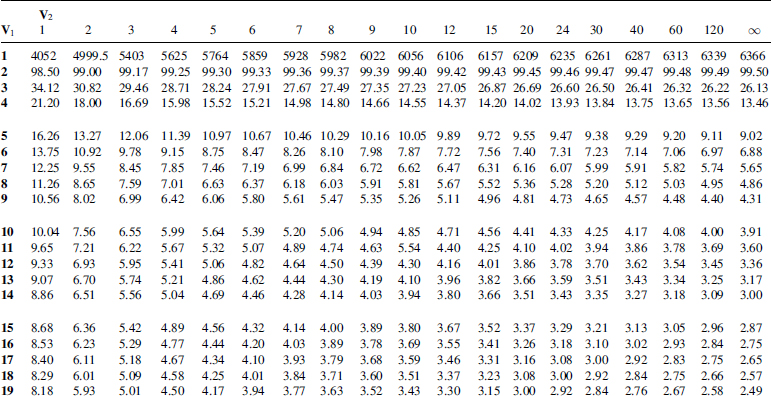
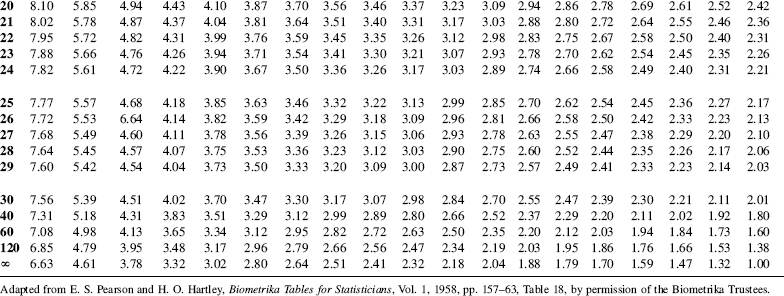
Table A.7. F-distribution where α = 0.005
Get Making Sense of Data: A Practical Guide to Exploratory Data Analysis and Data Mining now with the O’Reilly learning platform.
O’Reilly members experience books, live events, courses curated by job role, and more from O’Reilly and nearly 200 top publishers.

