F.1 Maximization using Solver
Use of Solver is illustrated with an example in which maximum likelihood estimates for the gamma distribution are found for Data Set B right censored at 200. If you have not read far enough to appreciate this example, it is not important.
Begin by setting up a spreadsheet in which the parameters (alpha and theta) are in identifiable cells as is the objective function (lnL). In this example, the parameters are in E1 and E2 and the objective function is in E3.1 Other than the menu/ribbon, the screenshots here are likely to be the same for all versions (checked through Excel® 2007).
Figure F.1
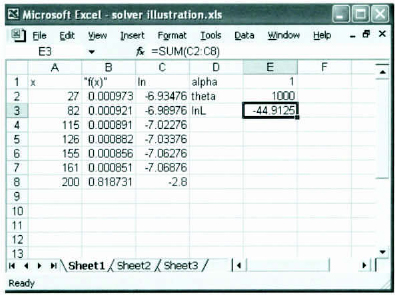
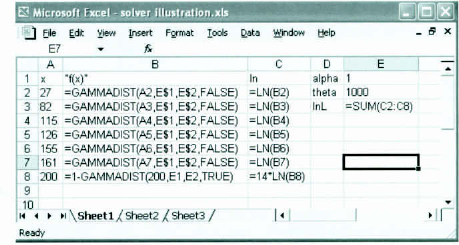
The formulas underlying this spreadsheet are shown here. Note that trial values for alpha and theta have been entered (1 and 1,000). The better these guesses are, the higher the probability that Solver will succeed in finding the maximum.
Figure F.2
Running Solver brings up the following dialog box:
Figure F.3
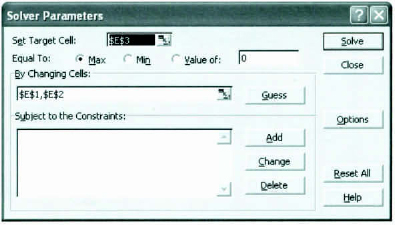
The target cell is the location of the objective function and the By Changing Cells box contains the location of the parameters. These cells need not be contiguous. It turns out that clicking on Solve will get the job done, but there are two additional ...
Get Loss Models: From Data to Decisions, 4th Edition now with the O’Reilly learning platform.
O’Reilly members experience books, live events, courses curated by job role, and more from O’Reilly and nearly 200 top publishers.

