Chapter 14. Performance and Debugging
At some point during its development, every game will have performance issues, and every game will crash. Fortunately, iOS has some of the best tools around for squeezing as much performance as possible out of your games and finding bugs and other issues.
In this chapter, you’ll learn about how to use these tools, how to fix problems, and how to get information about how your game’s behaving.
Improving Your Frame Rate
Problem
You need to coax a better frame rate out of your game so that it plays smoothly.
Solution
To improve your frame rate, you first need to determine where the majority of the work is being done. In Xcode:
- From the Scheme menu, select your device, so that the application will be installed to the device when you build.
Open the Product menu and choose Profile (or press Command-I).
The application will build and install onto the device, and Instruments will open and show the template picker (Figure 14-1).
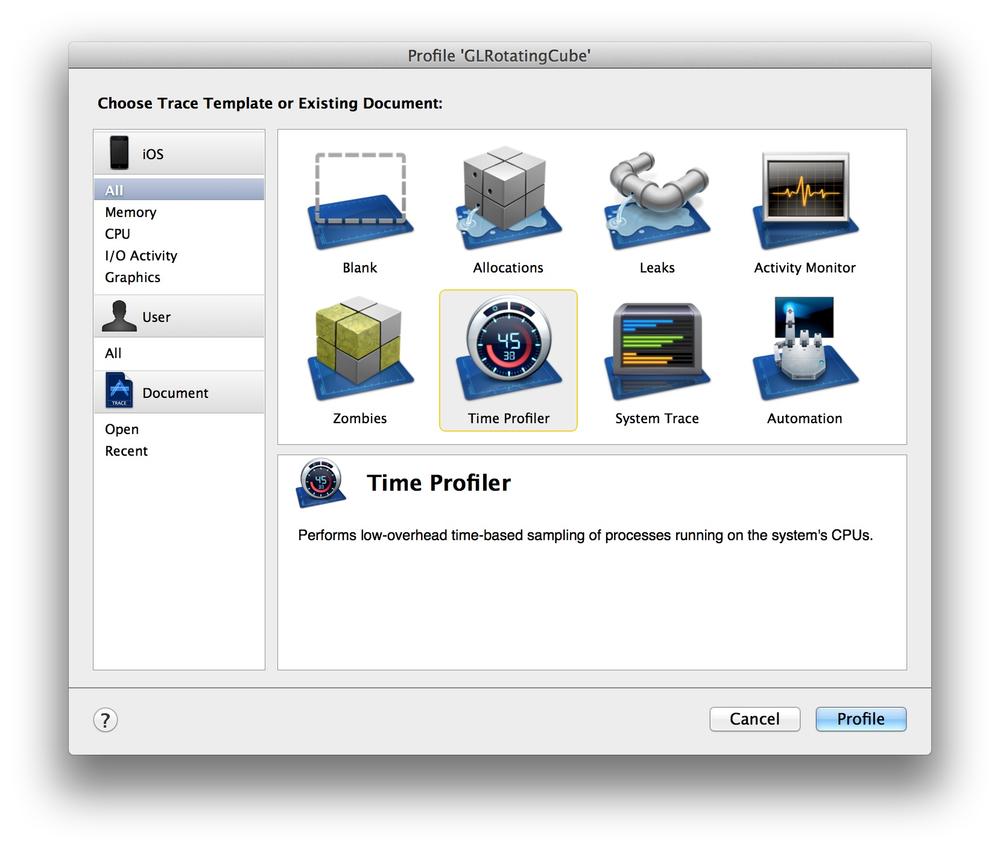 Figure 14-1. Selecting the Instruments template
- Select the Time Profiler instrument and run your game for a while. You’ll start seeing information about how much CPU time your game is taking up.
Turn on Invert Call Tree and Show Obj-C Only, and turn off everything else in the list, as shown in Figure 14-2.
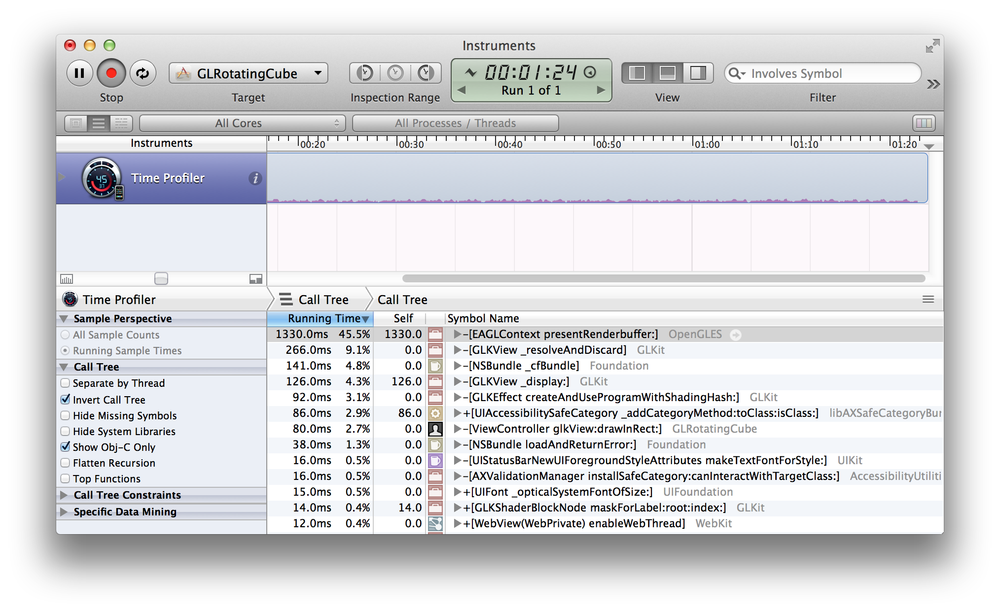 Figure 14-2. Instruments in ...
Get iOS Game Development Cookbook now with the O’Reilly learning platform.
O’Reilly members experience books, live events, courses curated by job role, and more from O’Reilly and nearly 200 top publishers.

