APPENDIX A
STATISTICAL TABLES
Table A.1 Cumulative Standard Normal Distribution
Table A.2 Percentage Points of the χ2 Distribution
Table A.3 Percentage Points of the t Distribution
Table A.4 Percentage Points of the F Distribution
TABLE A.1 Cumulative Standard Normal Distribution
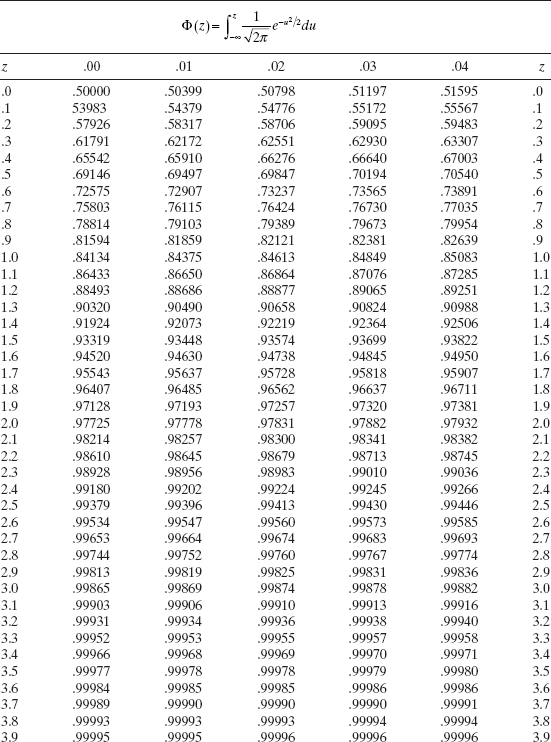
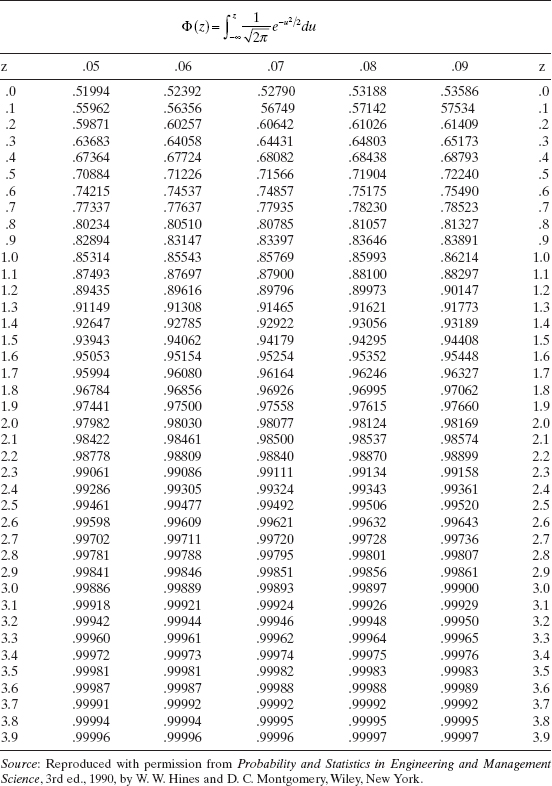
TABLE A.2 Percentage Points of the χ2 Distribntion
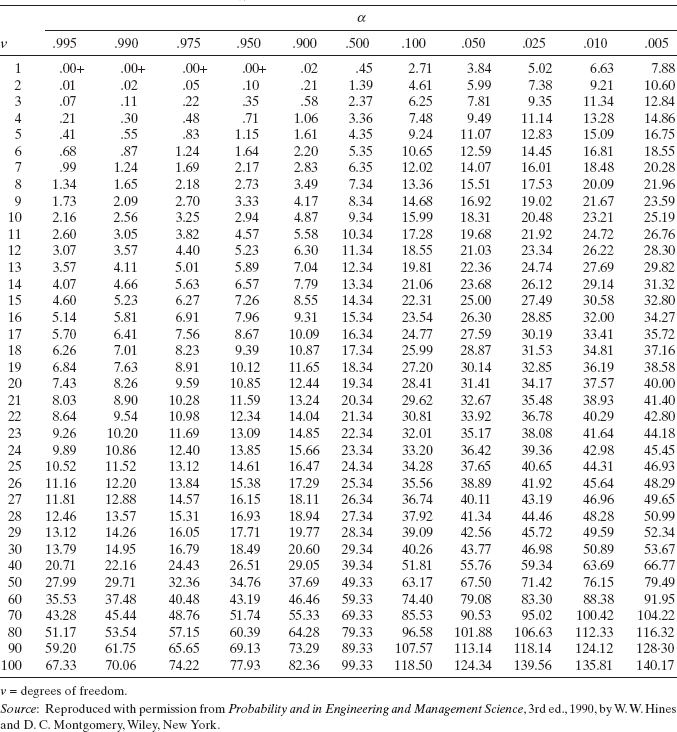
TABLE A.3 Percentage Points of the t Distribution
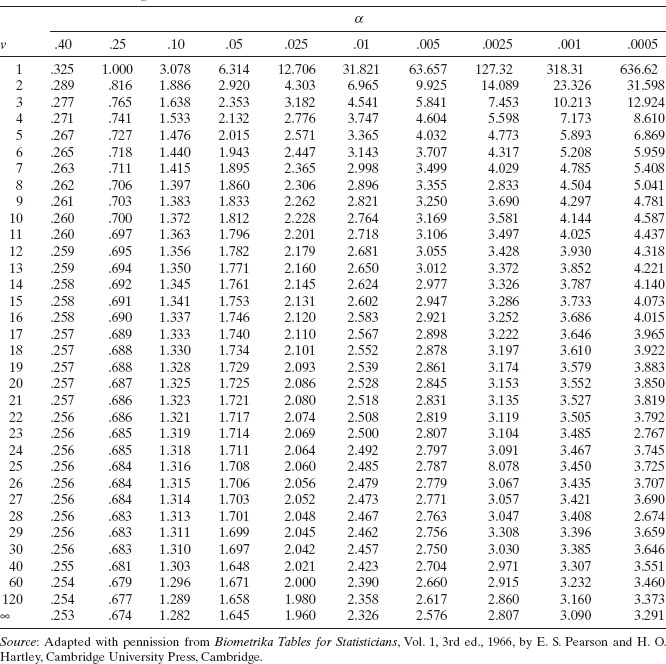
TABLE A.4 Percentage Points of the F-Distribution
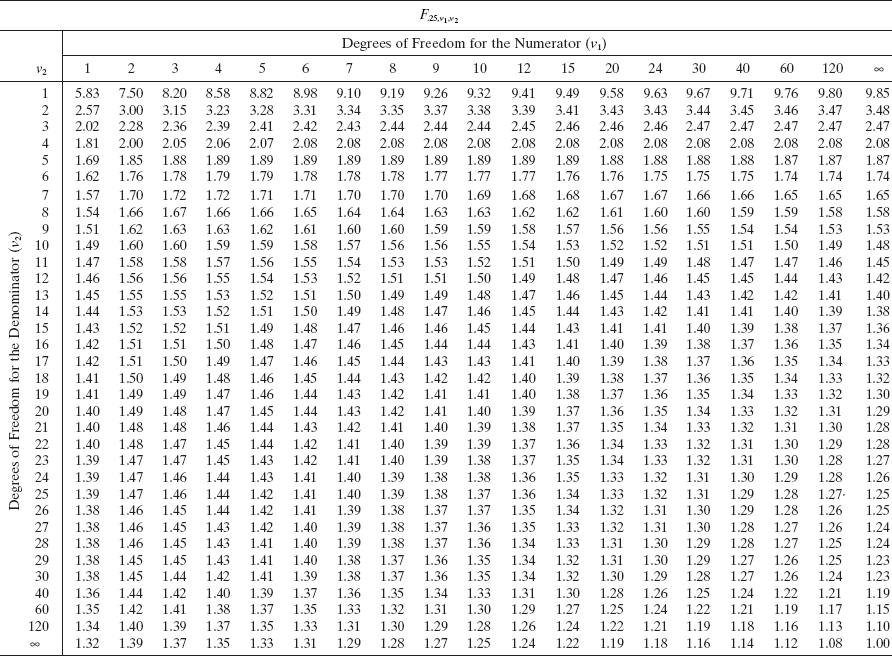
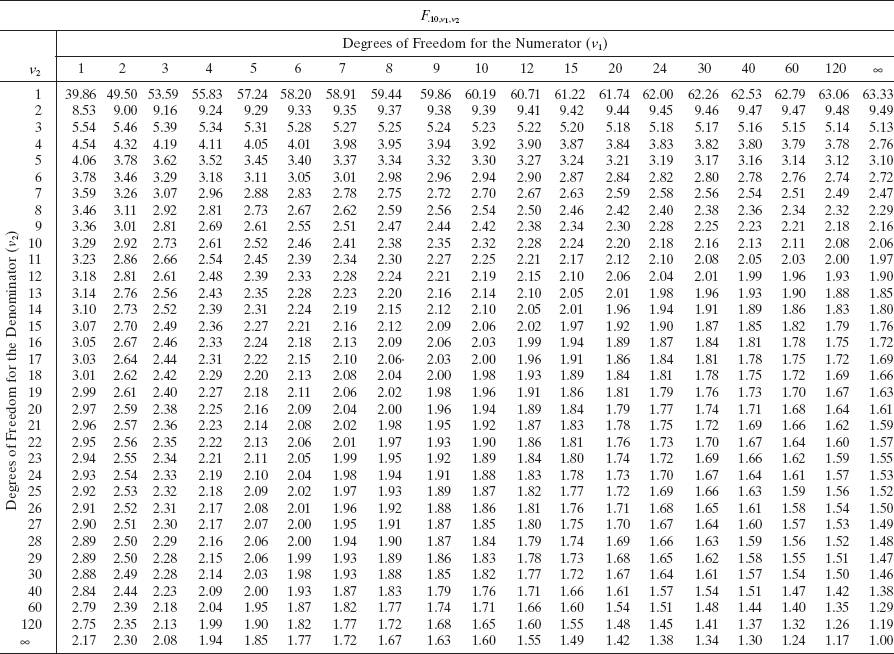
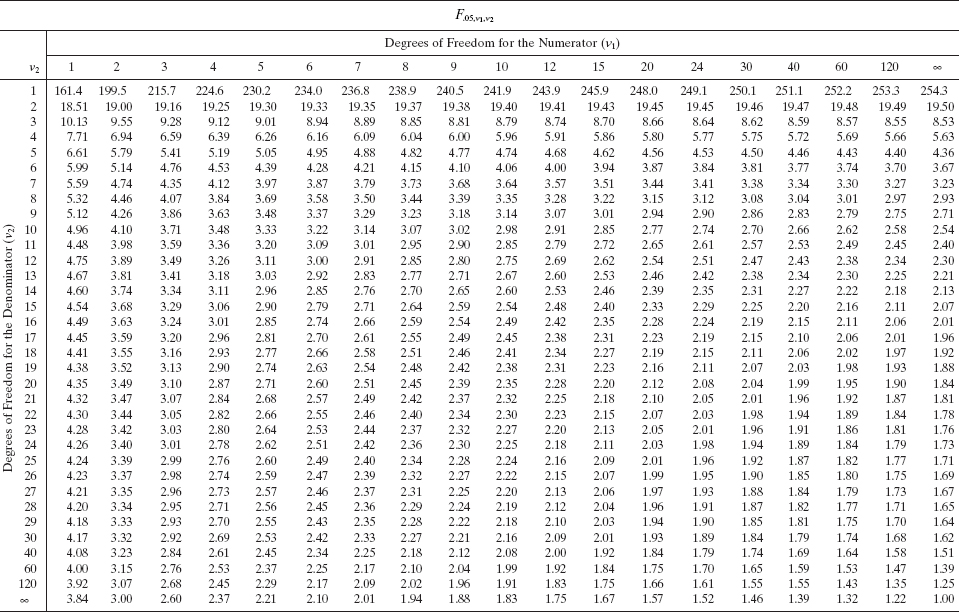
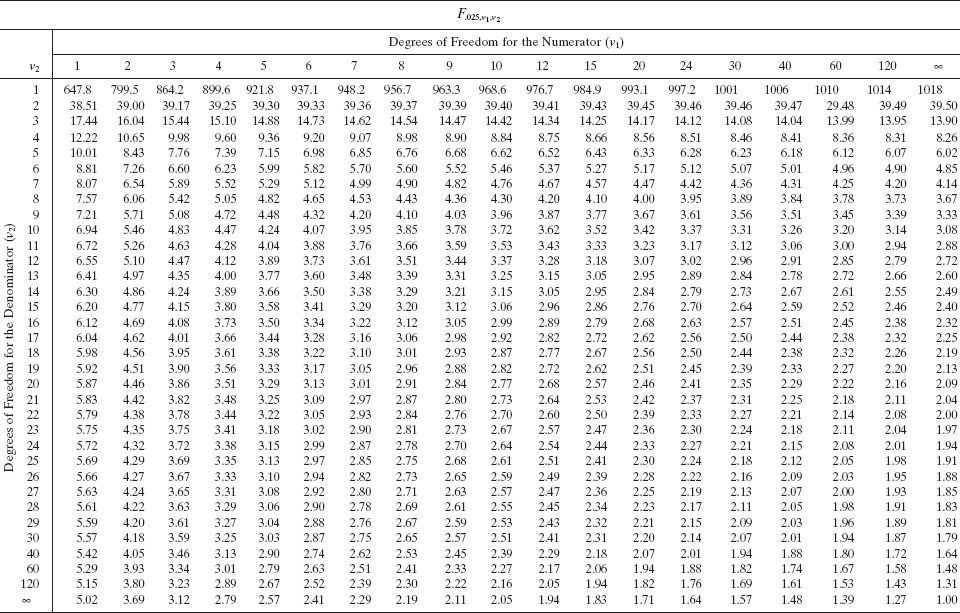
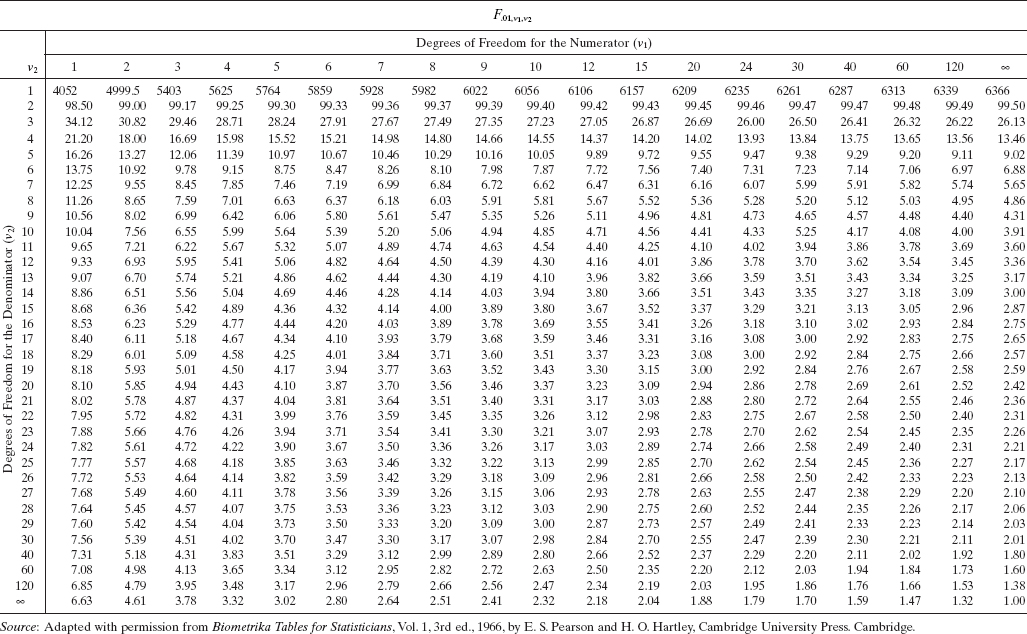
TABLE A.5 Orthogonal Polynomials
TABLE A.6 Critical Values of the Durbin—Watson ...
Get Introduction to Linear Regression Analysis, 5th Edition now with the O’Reilly learning platform.
O’Reilly members experience books, live events, courses curated by job role, and more from O’Reilly and nearly 200 top publishers.

