Nonuniform Rainfall
The raster in the figure was developed without an input weight raster. It was assumed, therefore, that each, received the same amount of rain and was presumed to receive the same amount of water. You can change that by specifying a number for each cell in the study area. Consider an input weight raster that looks like Figure 8-28. This weight raster represents a gradation in rainfall, which was heaviest in the north.
FIGURE 8-28 A weight raster: more rainfall in the northern part of the raster
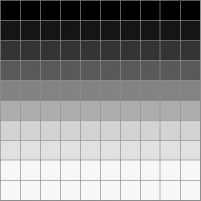
If you consider that this was a rainfall event, and that the values in the raster cells, which vary from almost nothing to more than 1.5, constitute inches of rainfall, you can see that much more rain fell in the north than in the south across the study area. The total amount of rainfall is approximately the same as in the previous example, but in that case the rainfall was distributed uniformly.
Now you can apply the Flow Accumulation calculation with this weight raster. The results, shown in Figure 8-29, indicate that considerably more water volume showed up at the western pour point than before, because the rain was lighter in the south. In fact, with the weight raster, about as much water flows west as south. Recall that with no weight raster, almost twice as much flowed south as west.
FIGURE 8-29 Flow accumulation taking into account the weight raster
This raster ...
Get Introducing Geographic Information Systems with ArcGIS: A Workbook Approach to Learning GIS, 3rd Edition now with the O’Reilly learning platform.
O’Reilly members experience books, live events, courses curated by job role, and more from O’Reilly and nearly 200 top publishers.

