Introducing the Conversion Columns
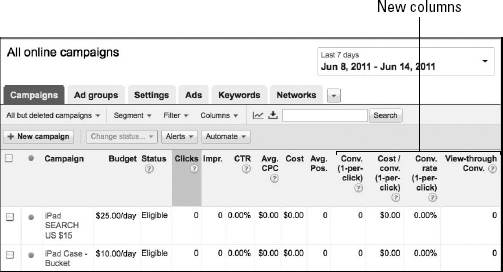
After you trigger conversion tracking by generating the code snippet, Google shows you four new columns (as shown in Figure 6-4) on the campaign management pages: Conv. (conversions), Cost/Conv. (cost per conversion), Conv. Rate (conversion rate), and View-through Conv. We're not going to talk about View-through Conversions, but instead focus on the other three.
These columns also appear at the ad group, keyword, placement, and ad levels, so you can see the effectiveness of every unit of your AdWords account. Until you place the conversion code on your site and visitors start converting, you will see zeroes in those columns. Also, expect a 24-hour delay in reporting a conversion.
Figure 6-4: New columns appear after you initiate conversion tracking.
Conv.
These columns tell you how many conversions were generated by the element in that row: campaign, ad group, keyword, placement, or ad. In Figure 6-5, we show a client account of ours (http://continuingedexpress.com; they provide ongoing real estate education) to show you what your account will look like when you start generating conversions. You can see four ad groups in the campaign, all of which have led to conversions. The Continuing Ed Express ad group generated 64 1-per-click conversions.
Figure 6-5: Conversion statistics help you calculate the ROI of your ad groups.
“1-per-click” refers ...
Get Google AdWords™ For Dummies®, 3rd Edition now with the O’Reilly learning platform.
O’Reilly members experience books, live events, courses curated by job role, and more from O’Reilly and nearly 200 top publishers.

